

I’ve been testing the Acer Aspire V5 122P, a subnotebook based on the new AMD Temash platform. As part of my testing I’ve been doing some CPU and GPU-specific tests that will give people and idea of the processing power and efficiency of the A6-1450 platform. You are invited to request a test if you feel it will add something to the assessment.
Test device: Acer Aspire V5 122P with 4GB RAM, 500GB Hard Drive. Original OS build (Windows 8)
Processes after boot: 59.
All tests run in High-Performance mode and CPU speed checked: 1.39Ghz.
Heat / Noise of the system will be addresses in the product review. No comment or summary is being made here. This post is just for test results. Problems of achieving a constant 1.39Ghz clock will be addressed in the Acer Aspire V5 122P review.
IMPORTANT NOTE: A background process is continuously taking 2-10% while these tests (System process, average 7%.) When assessing CPU performance the figures should be considered as 0.93 X total maximum possible.
Sunspider 0.9.1
- IE 11 – 456ms
- Chrome 26.0 – 630ms
Peacekeeper Browser Test
Chrome 26.0 – 1205
Passmark performance test
Comparisons in brackets are always against the average of three Passmark scores for the Core i3 2377M.) Overall score (includes disk testing) 741
- CPU Mark: 1840 (A Sandy Bridge Core i3 2377M at 1.5Ghz is 5% faster according to PassMark)
- Normalised clock CPU Mark (taking into consideration the 7% b/g CPU usage) 2119:1935(Core i3 2377M at 1.5Ghz ) = (1.09:1)
- Integer Math: 4066 (Core i3 2377M at 1.5Ghz = 26% slower)
- Floating Point Math: 1944 (Core i3 2377M = 27% slower)
- Prime Numbers: 3.98 (Core i3-2377M = 80% faster)
- Extended Instructions SSE: 6.2 (Core i3-2377M = 48% faster)
- CPU Compression: 2663 (Core i3-2377M = 8% slower)
- CPU Encryption: 387.5 (Core i3-2377M = 35% slower)
- CPU Physics: 86.2 (Core i3-2377M = 50% faster)
- CPU Sorting: 1630 Core i3-2377M = 10% slower)
- CPU Single Thread: 564 (Core i3-2377M = 40% faster)
Passmark Graphics Tests:
- 3D Graphics Mark: 276.6 (Core i3-2377M = 3% slower)
- Graphics 3D DirectX 9 Simple: 22.0 (Core i3-2377M = 11% slower)
- Graphics 3D DirectX 9 Complex: 12.3 (Core i3-2377M = 3% slower)
- Graphics 3D DirectX 10: 1.63 (Core i3-2377M = 76.% faster)
- Graphics 3D DirectX 11: 5.1 (n/a)
- Graphics 3D DirectCompute: 152.5 (n/a)
Video Playback
Windows Media Player: H.264 + Dolby (.mts AVCHD) 50fps 30Mbps 1080p – CPU level: 5-9% (WMP process only)
YouTube 1080p Playback (Planet Earth: Amazing Nature Scenery 1080p HD)
- Google Chrome Flash playback: 100% CPU in use, some frame drops.
- Google Chrome HTML5 playback: Approx 20% CPU used by Chrome processes
- IE10 HTML5: 5-7% CPU
- IE 10 Flash: Approx 10%
CrystalMark 2004R3 CPU tests
- ALU Fibonacci: 8239
- ALU Napeirian: 5370
- ALU Eratosthenes: 2529
- ALU Quick Start: 5206
- ALU Total: 21366
- FPU MikoFPU:2569
- FPU RandMeanSS: 8670
- FPU FFT:4563
- FPU Mandelbrot:3276
- FPU Total: 19100
CPU power usage.
Without specialised test equipment it is difficult to do this in a controlled way but by using Perfmon to show the battery power drain figures and running a pure CPU test in quiescent and test state and by noting the % CPU load used by the test process, a rough figure can be calculated. Some DC-DC losses must be factored into the equation but these are estimated at <10%. Update: There may be memory/bus usage during these tests.
Test done on high-performance profile under battery power.
Test 2 CrystalmarK ALU
Standing usage immediately before test: 7.9W (7% utilization, ave 1Ghz clock in quiescent state)
System max power drain during test: 12.3W (94% CPU load by Crystalmark Process)
Test power: 4.4W
Normalised: 790mw/Core/Ghz
Test 2 CrystalmarK FPU
Standing usage immediately before test: 8.1W (7% utilization, ave 1Ghz clock in quiescent state)
System max power drain during test: 13.1W (94% CPU load by Crystalmark Process)
Test power: 5W
Normalised: 900mw/Core/Ghz
Update 13:40 13 May 2013:
Test 3 – Prime95 Torture Test (Blend includes memory testing)
Standing usage immediately before test: 6.7W (7% utilization, ave 1Ghz clock in quiescent state)
System max power drain during test : 17.8W (91% CPU load by Prime95 Process)
Test power: 11.1W
Test 4 – Prime95 Torture Test (Small FFT minimal memory usage)
Standing usage immediately before test: 7.2W (7% utilization, ave 1Ghz clock in quiescent state)
Test max power drain : 15.8W (91% CPU load by Prime95 Process)
Test power: 8.6W
Normalised: 1700mW / Core / Ghz
Test5 Prime95 Toture (Blend) + Cinebench OPenGL
Standing usage immediately before test: 7.2W (7% utilization, ave 1Ghz clock in quiescent state)
System max power drain during test : 21.1W
Test power: 13.9 (CPU, GPU, Memory)
Estimated max power usage of 4 Temash CPU-cores at 1Ghz, 100%: 3.6W (+/- 10%)
Estimated max power usage of 4 Temash CPU-cores at 1.4Ghz, 100%: 5W (+/- 10%)
CrystalMark 2004R3 Memory Performance Tests
- Read: 4387 MB/s
- Write: 2104 MB/s
- Read/Write: 2116MB/s
- Cache: 44632 MB/s
- Mem Total: 13092
CrystalMark Overall Result at 1.4Ghz
Acer Aspire V5 122P CrystalMark – 85431


Cinebench and Power Utilisation
Again, note that these scores are with an average 7% CPU being taken by a ‘System’ processing the background. Done under battery power, high performance mode. CPU is at 1.39Ghz during the tests.
Test 1 Cinebench CPU multi-core 1.3 (1.39 theoretical at 100% CPU availability)
Perfmon drain measured differential: average, high-power profile: Standing average: 6.4W (7% utilization, ave 1Ghz clock), test average: 13.8 (88.2% CPU load by Cinebench Process = < 7.4W)
Test 2 Cinebench CPU single-core 0.36
Perfmon drain measured differential: average, high-power profile: Standing average: 6.4W (7% utilization, ave 1Ghz clock), test average: 9.8W (37% CPU load by Cinebench process = < 3.4W)
Power figures assume all additional power drain is due to additional CPU load. Difference in core/Ghz power usage is high between the two tests but fan overhead and GPU rendering work must be taken into account. This could be a significant part of the power drain.
Cinebench OpenGL 10.58 (best of three)
Power measurements using perfmon. Standing average: 6.6W (7% utilization, ave 1Ghz clock), test max: 17.7W Cinebench process was using 50% CPU. Differential: 11.1W
Platform Idle Power Utilisation
WiFi off, BT off, Sound Off, keyboard backlight off, Screen lowest setting, power saving mode, no foreground apps running, background tasks 7% average CPU utilisation. Power measured by Perfmon. (minimum figure taken.) Some pre-installed apps removed. (Office trial, WildTangent, Noton, Mcaffee)
Screen minimum: 4.14 W
Screen off: 4.04W
Screen 100%: 5.1W
Screen 50%: (enough for living-room usage) , 4.5W
Screen 50%, Wi-Fi On connected (802.11n, two walls from hotspot): 5.2W
Note/Warning: Keyboard backlight adds approx 1W
PCMark 7
PCMark 7 (System test – Acer Aspire V5-122P) – 1364
3DMark06
3DMark06 – 2946 (1280×768 resolution)
![]()
3DMark11
3DMark11 – 534 Points (1280×720 resolution, centred)

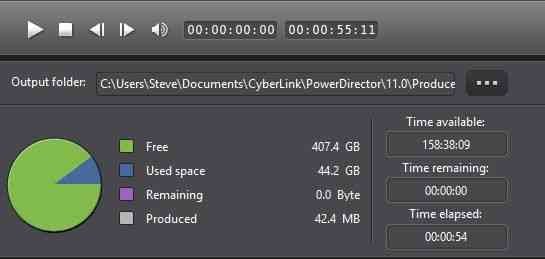
Power Director 10 Rendering Test.
Source: 55 second 1080p, 30Mbps, 25FPS, H.264 with DOlby audio.
Rendered in PowerDirector 10 with a 6mbps 720p H.264 profile in 79 seconds, Fast video rendering option not available.
Rendered in PowerDirector 11 with a 6mbps 720p H.264 profile in 54 seconds, Fast video rendering option available, enabled.
Rendered in PowerDirector 11 with a 6mbps 720p H.264 profile in 80 seconds, Fast video rendering option available, disabled.
Notes: Enabling ‘OPenCL acceleration’ in PowerDirector 11 as well as the default hardware acceleration resulted in no difference in rendering time.
As with previous AMD APUs it seems that the CUDA acceleration isn’t that strong. Testing PD11 next.
Performance is on-par with Intel Clovertrail. 720p editing possible with an SSD-based Temash system in our opinion. (PowerDirector 11 is a mid-range video editor that supports many forms of hardware acceleration)
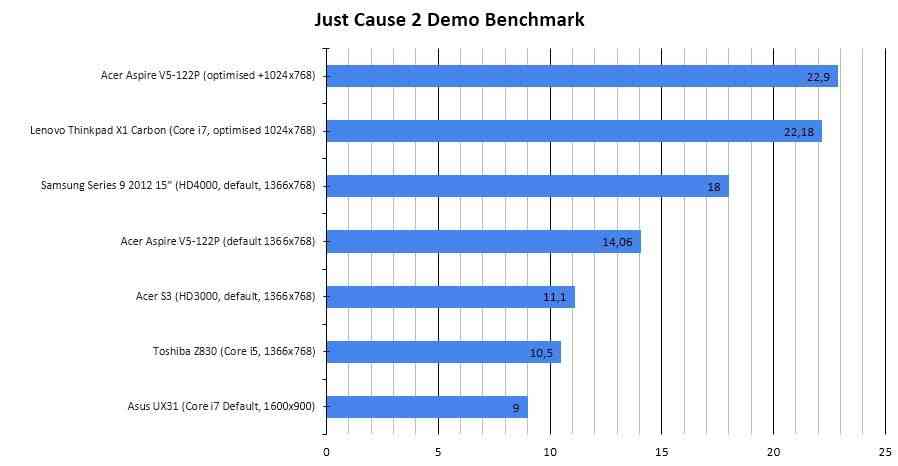
Gaming – Just Cause 2 Demo
I’ve chosen this demo as it’s the one I use for Ultrabook testing and I’m glad I did because it’s just beat a Lenovo X1 Carbon X1 in optimised settings. In default settings it lies somewhere between the HD3000 and HD4000 performance results we’ve seen to date which is more than the 3D benchmarks would suggest.
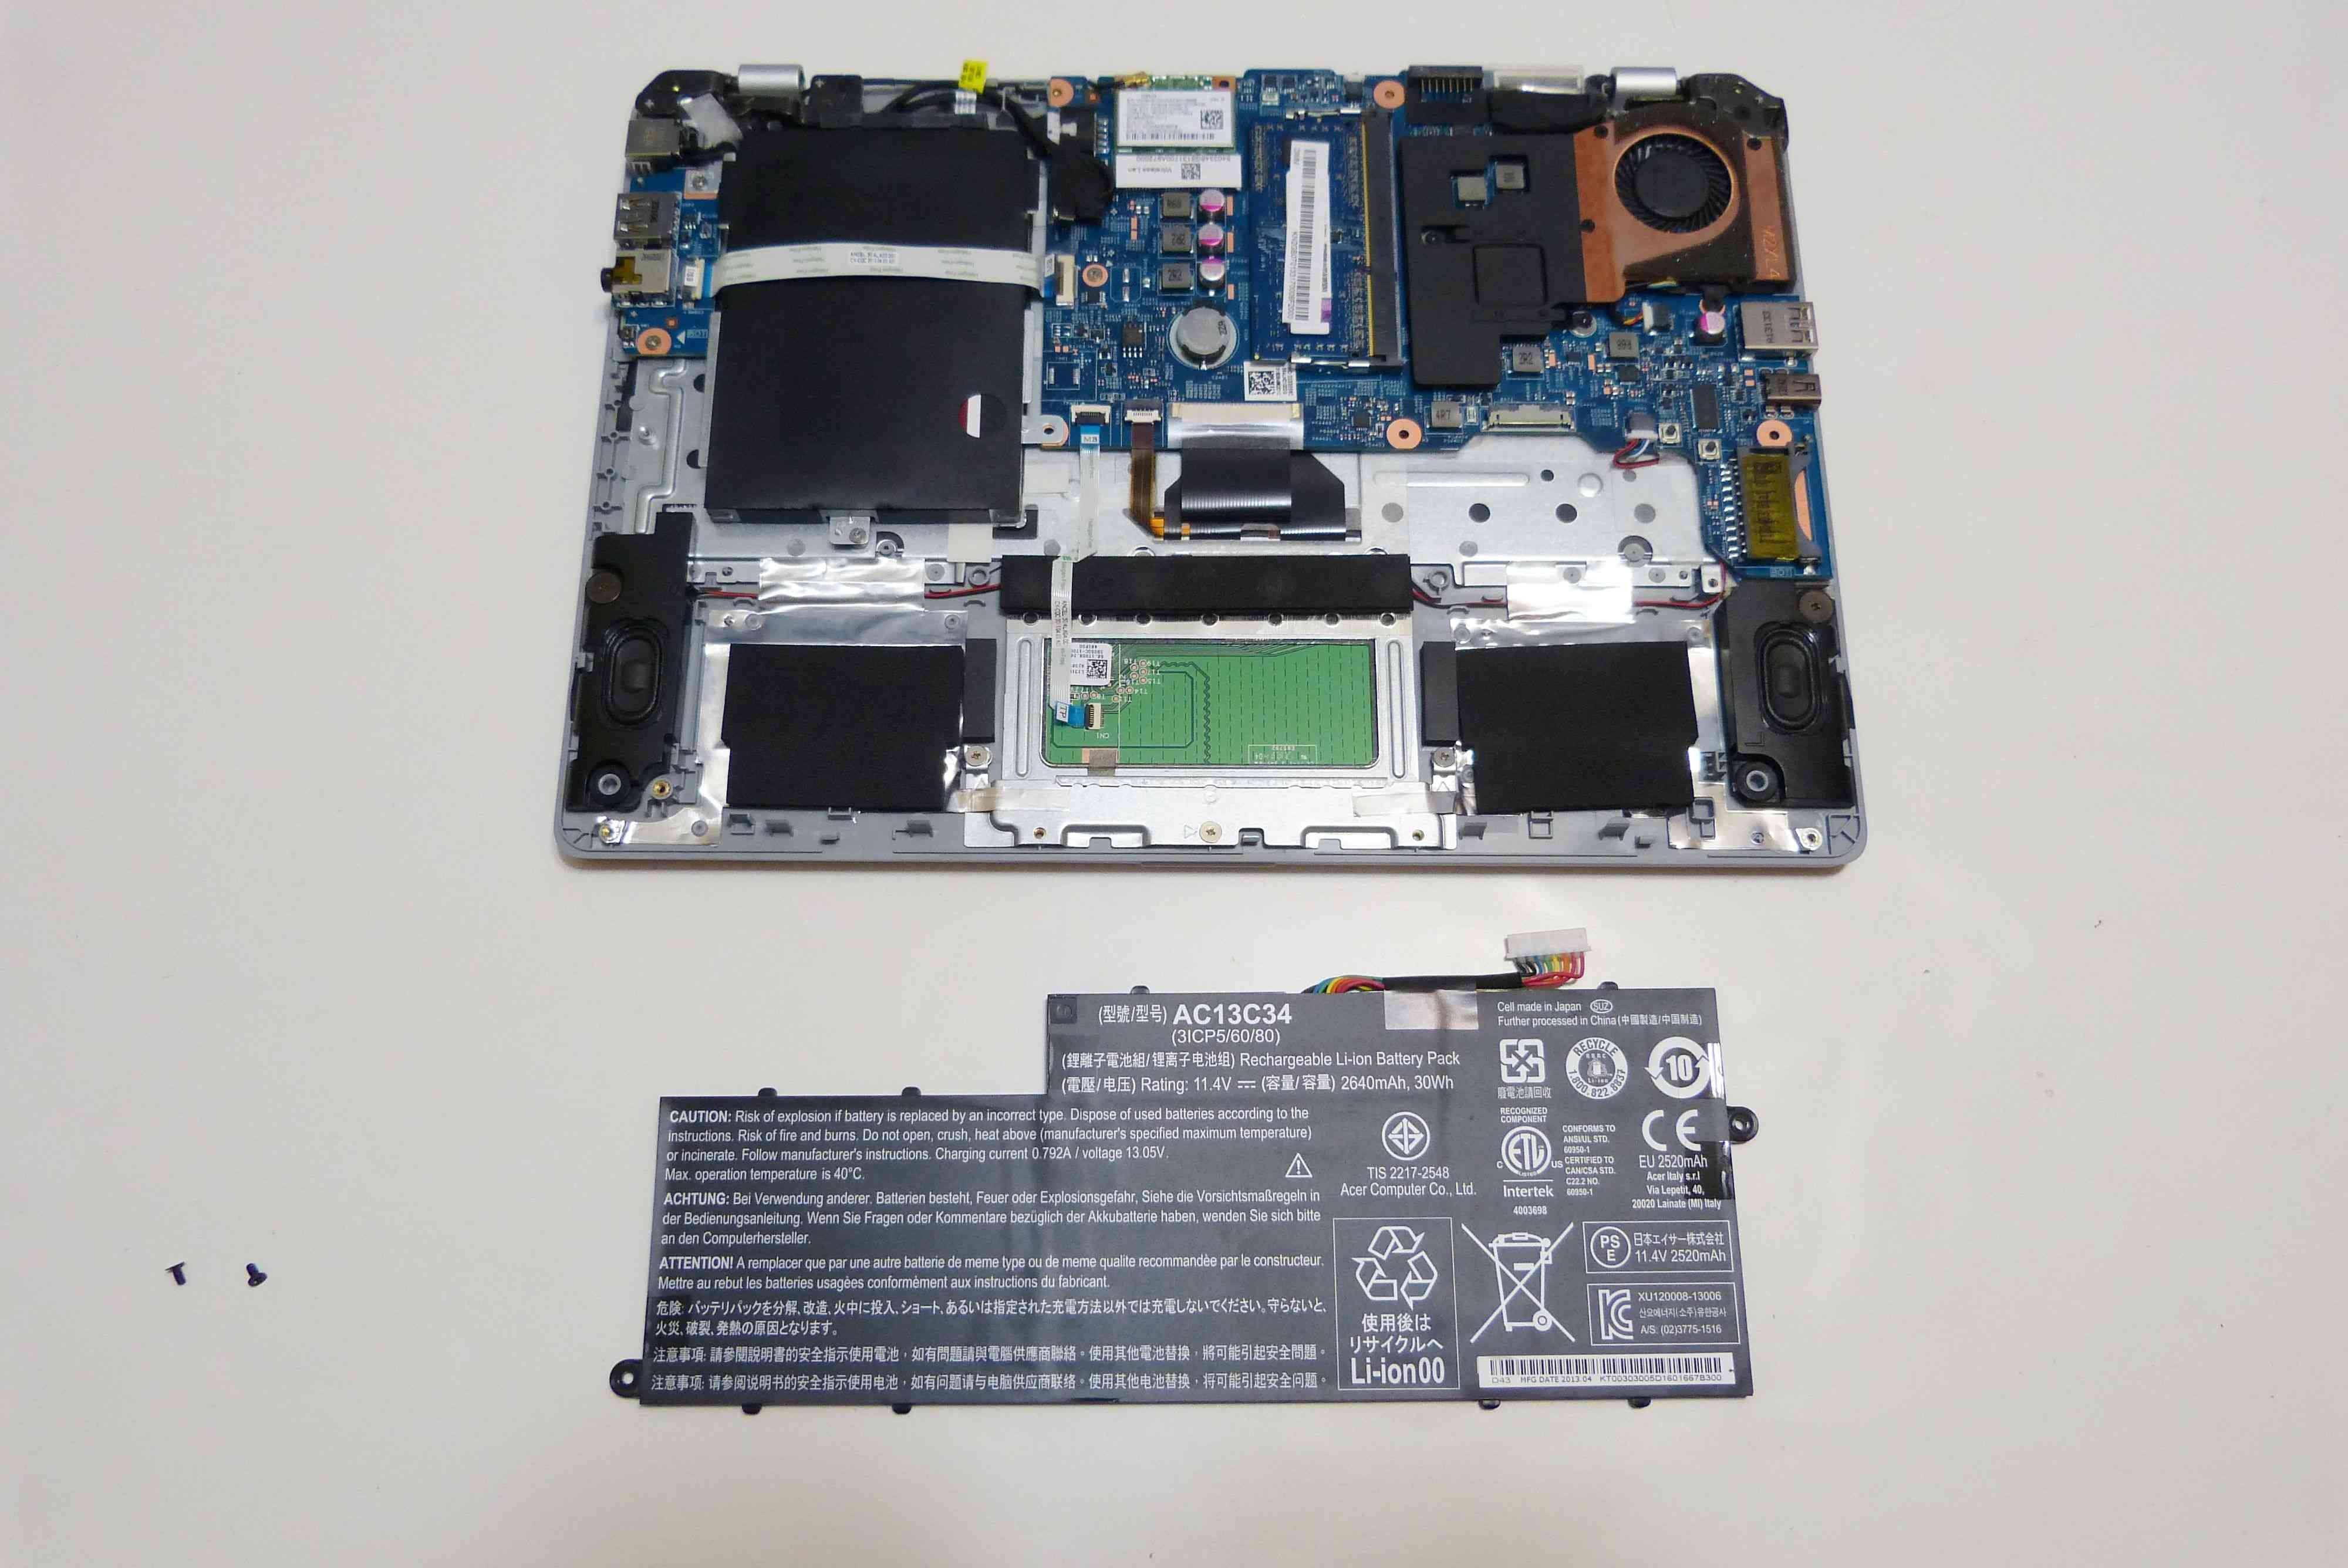
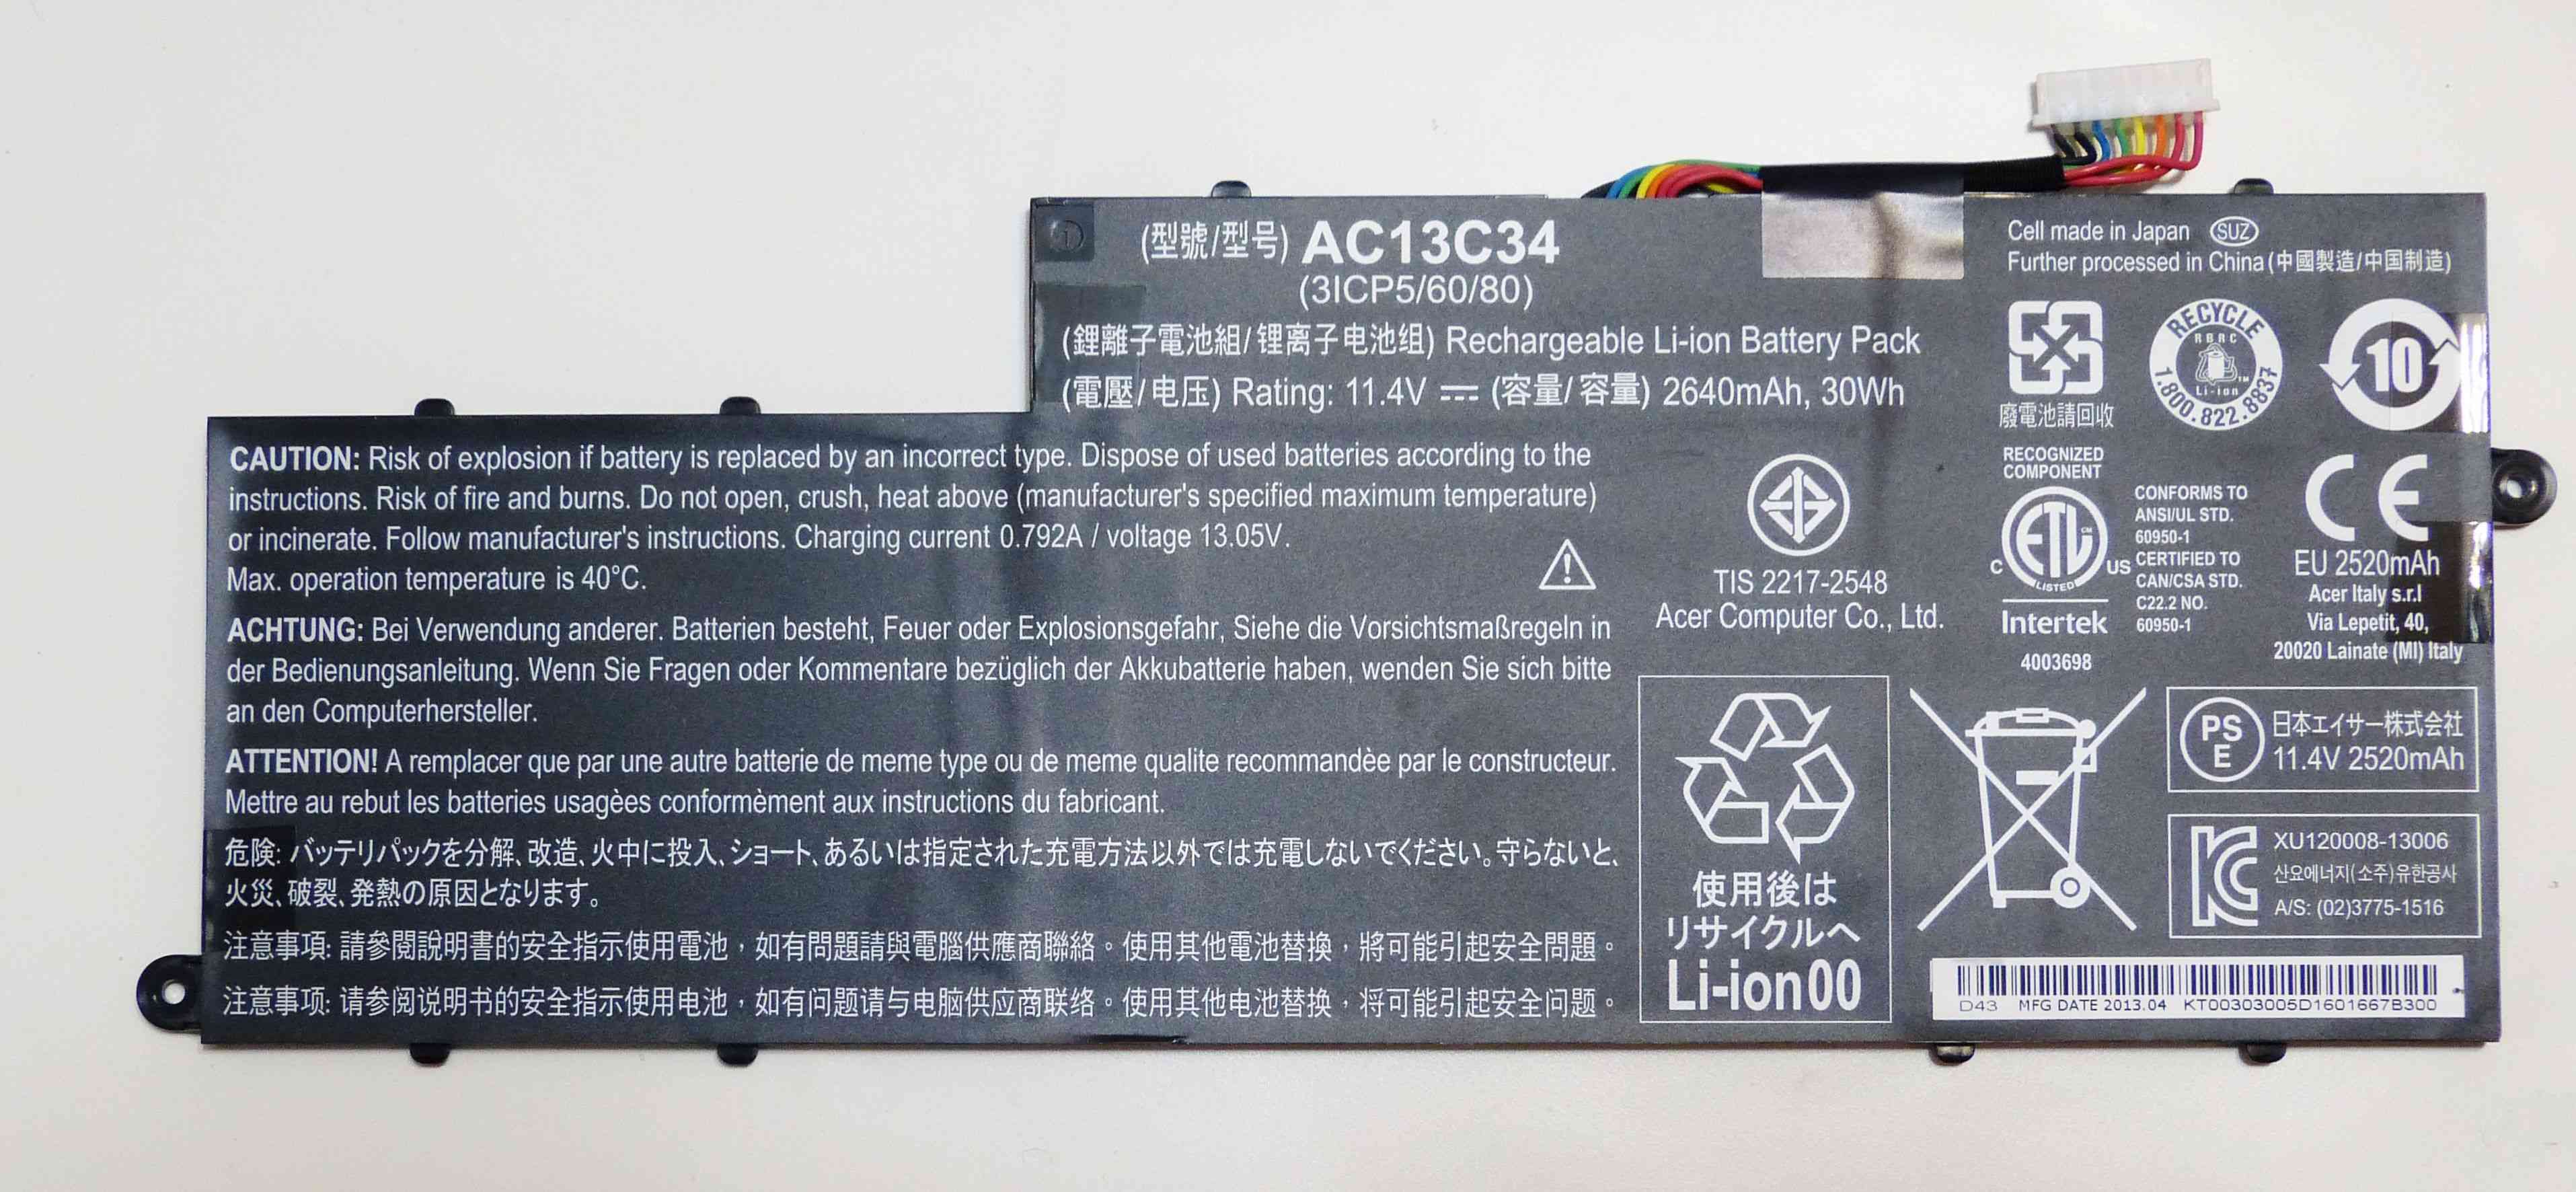
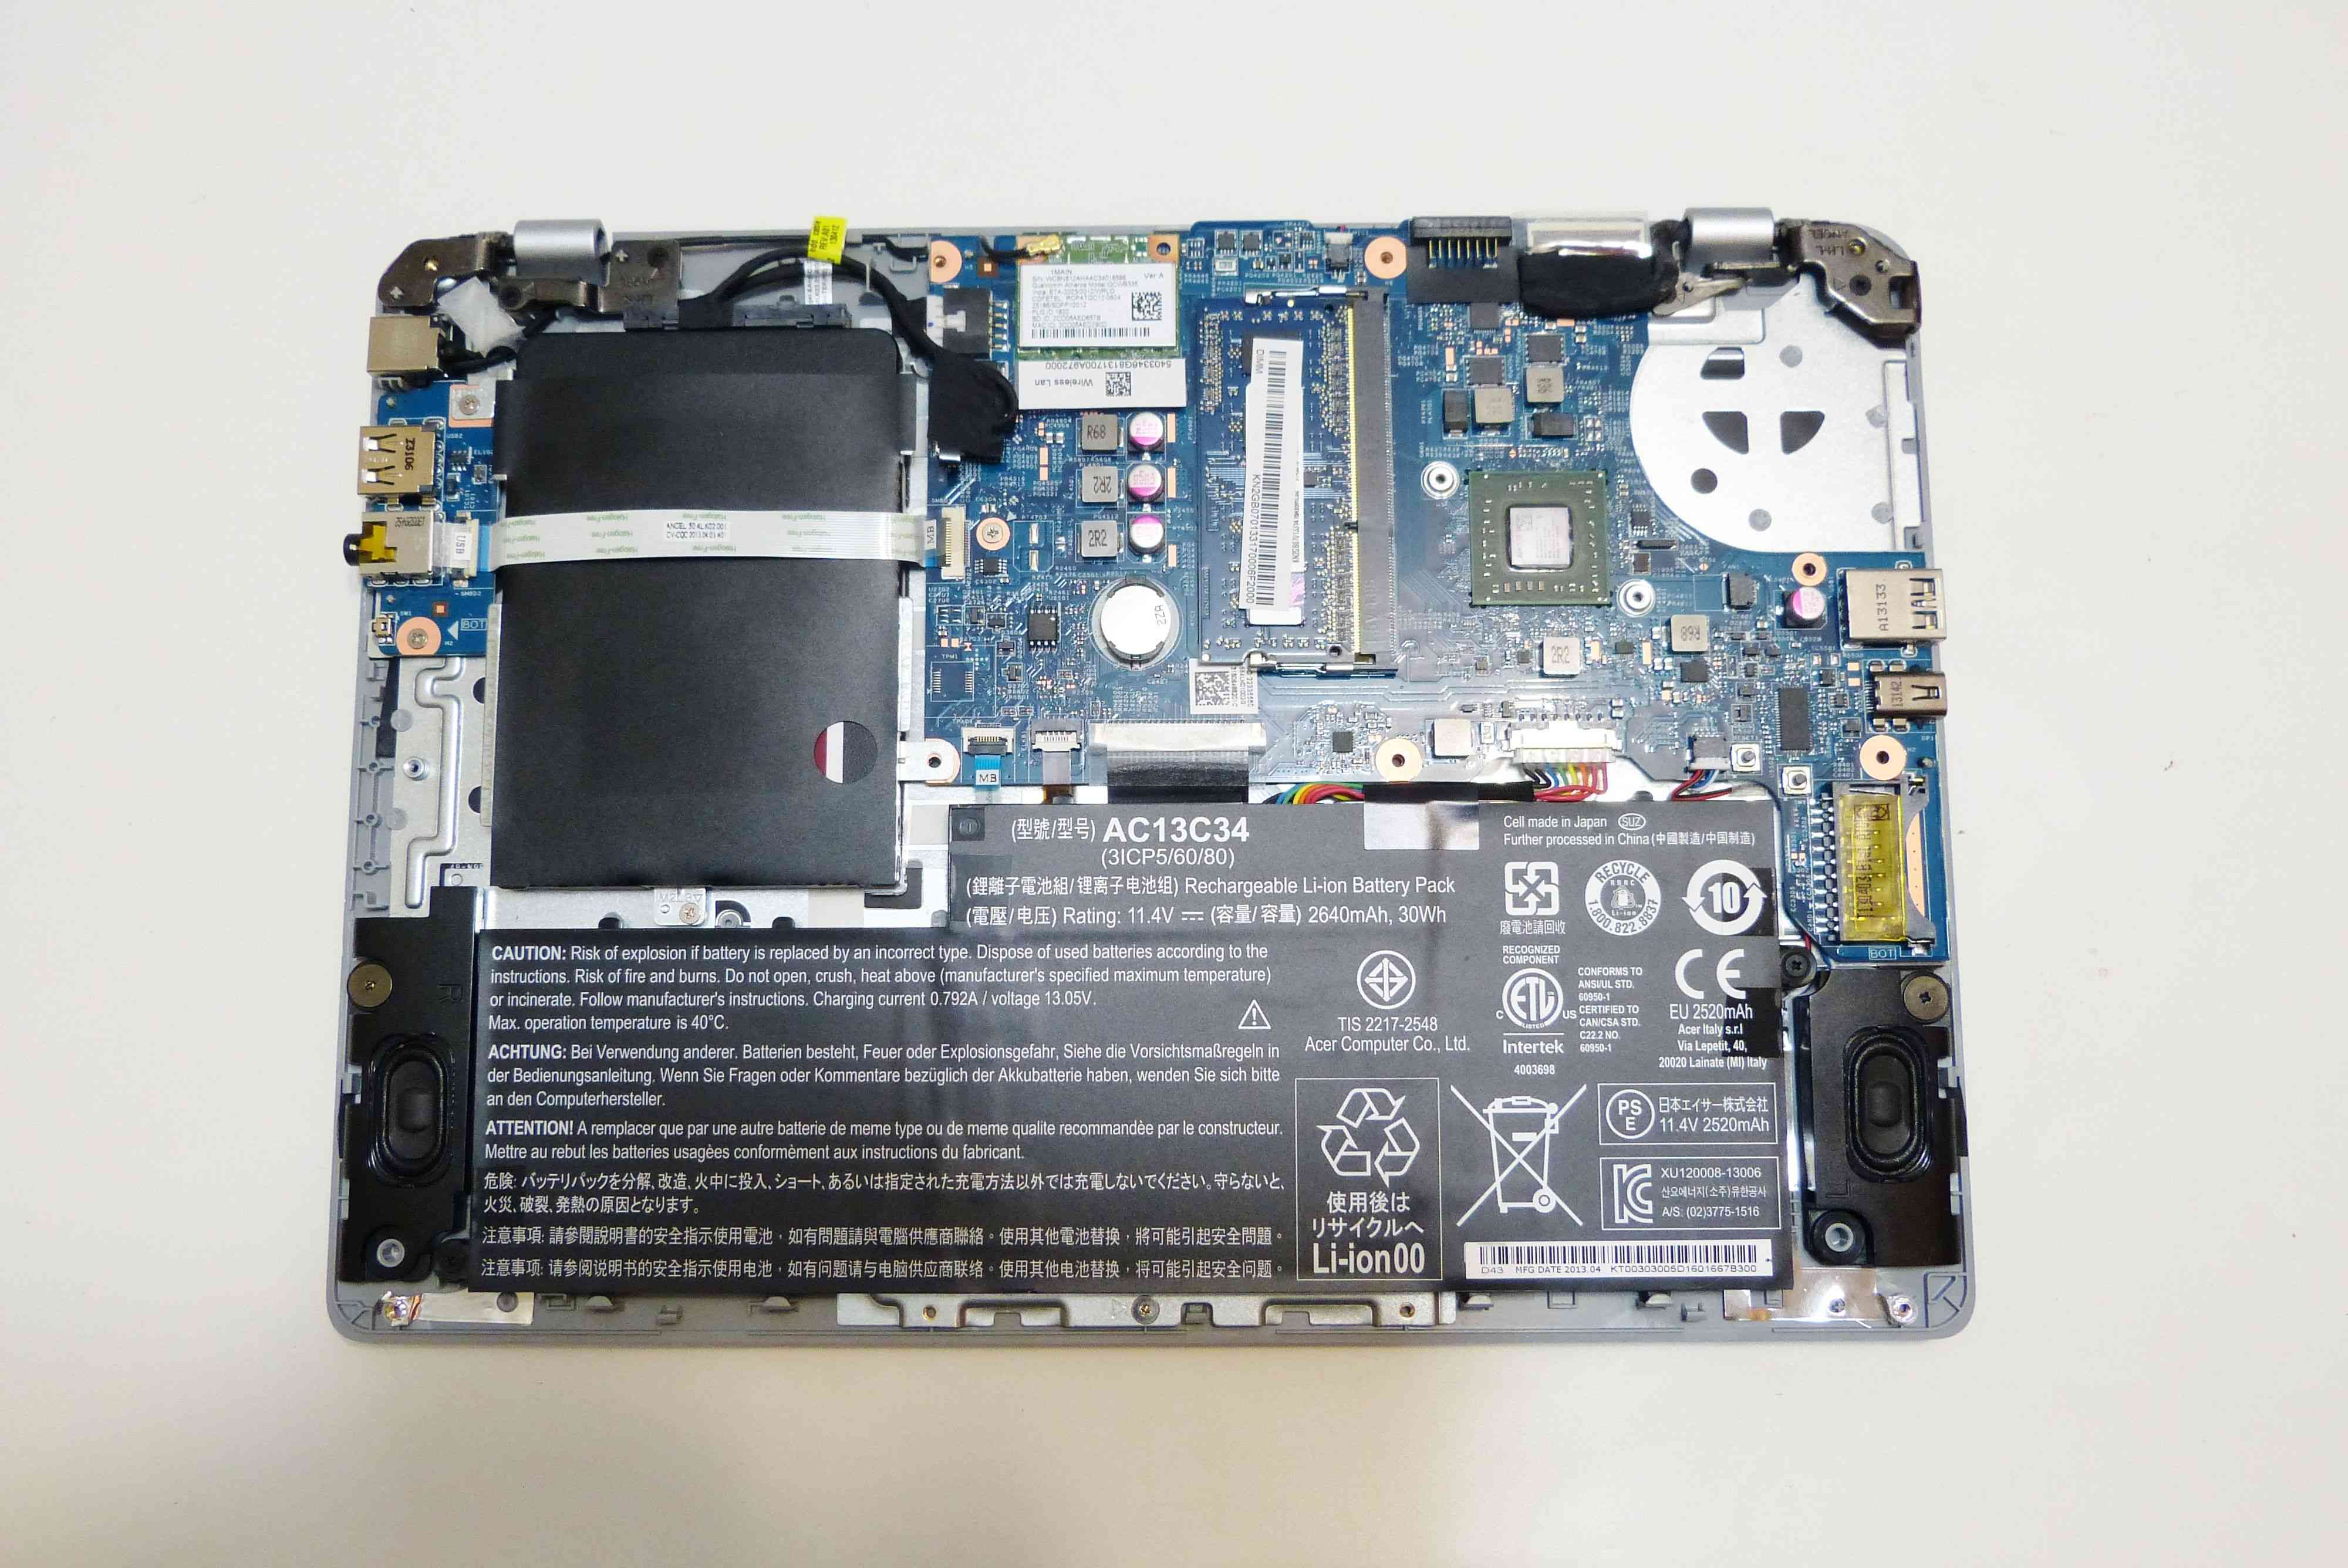
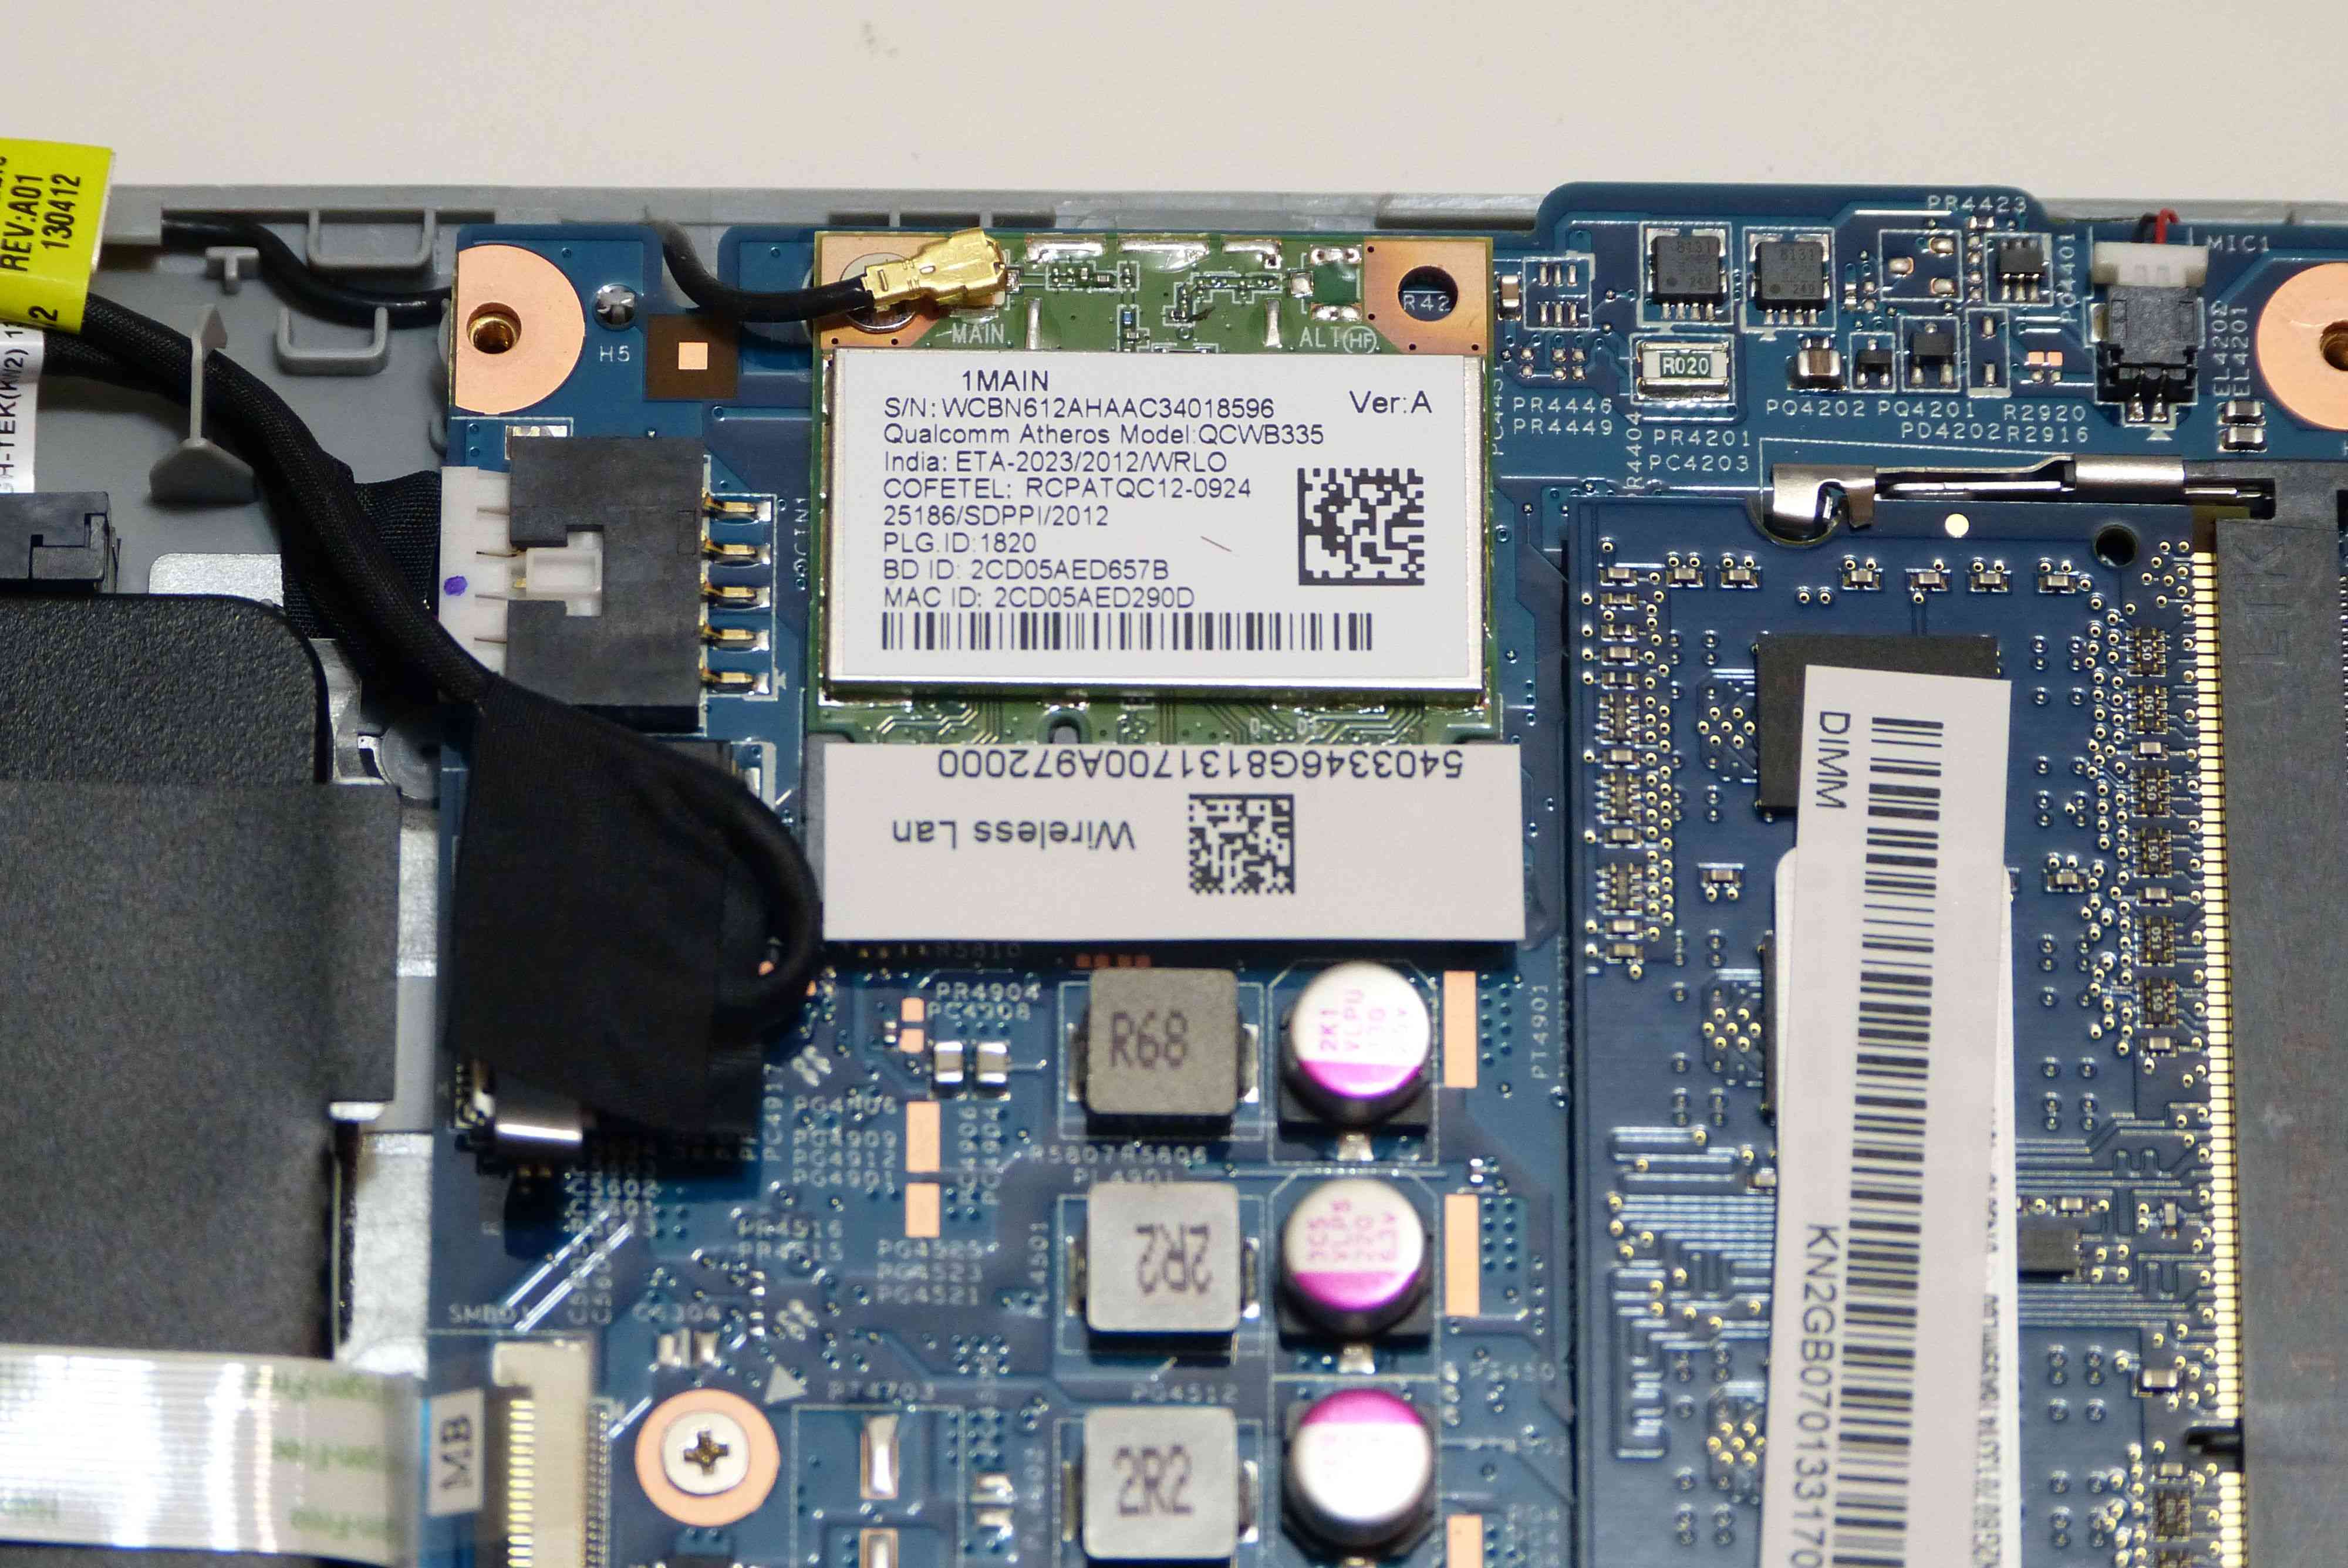
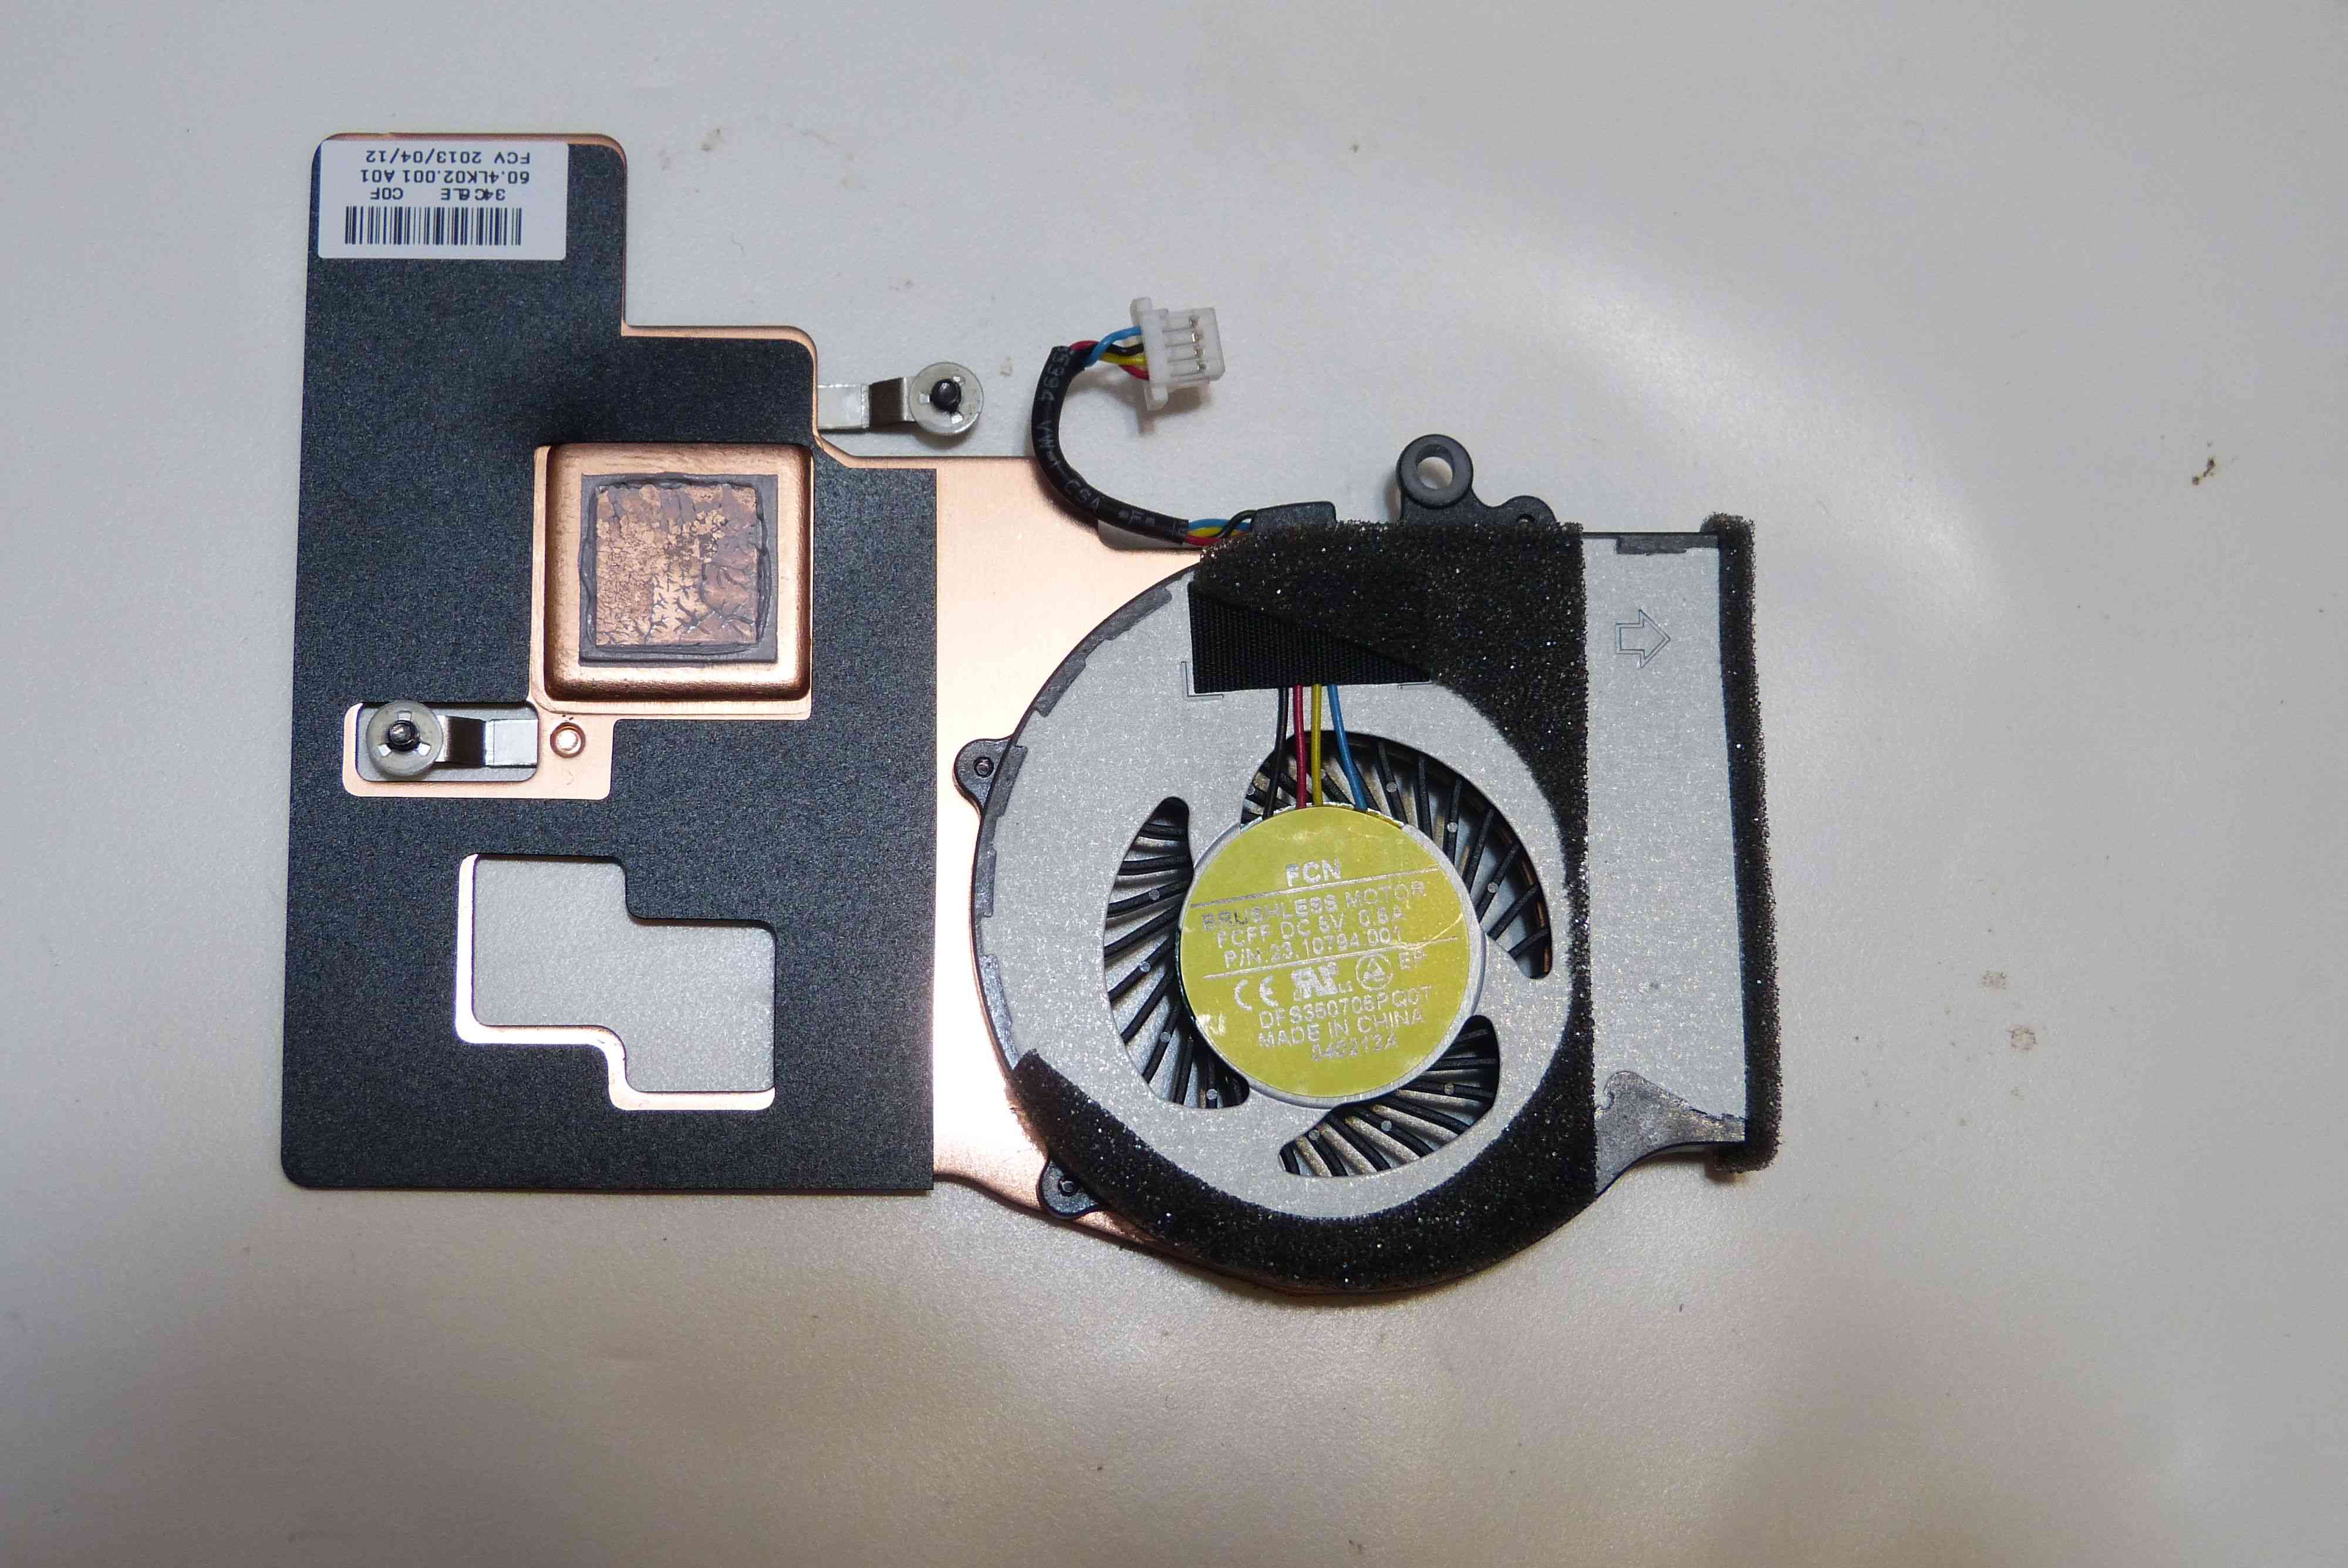
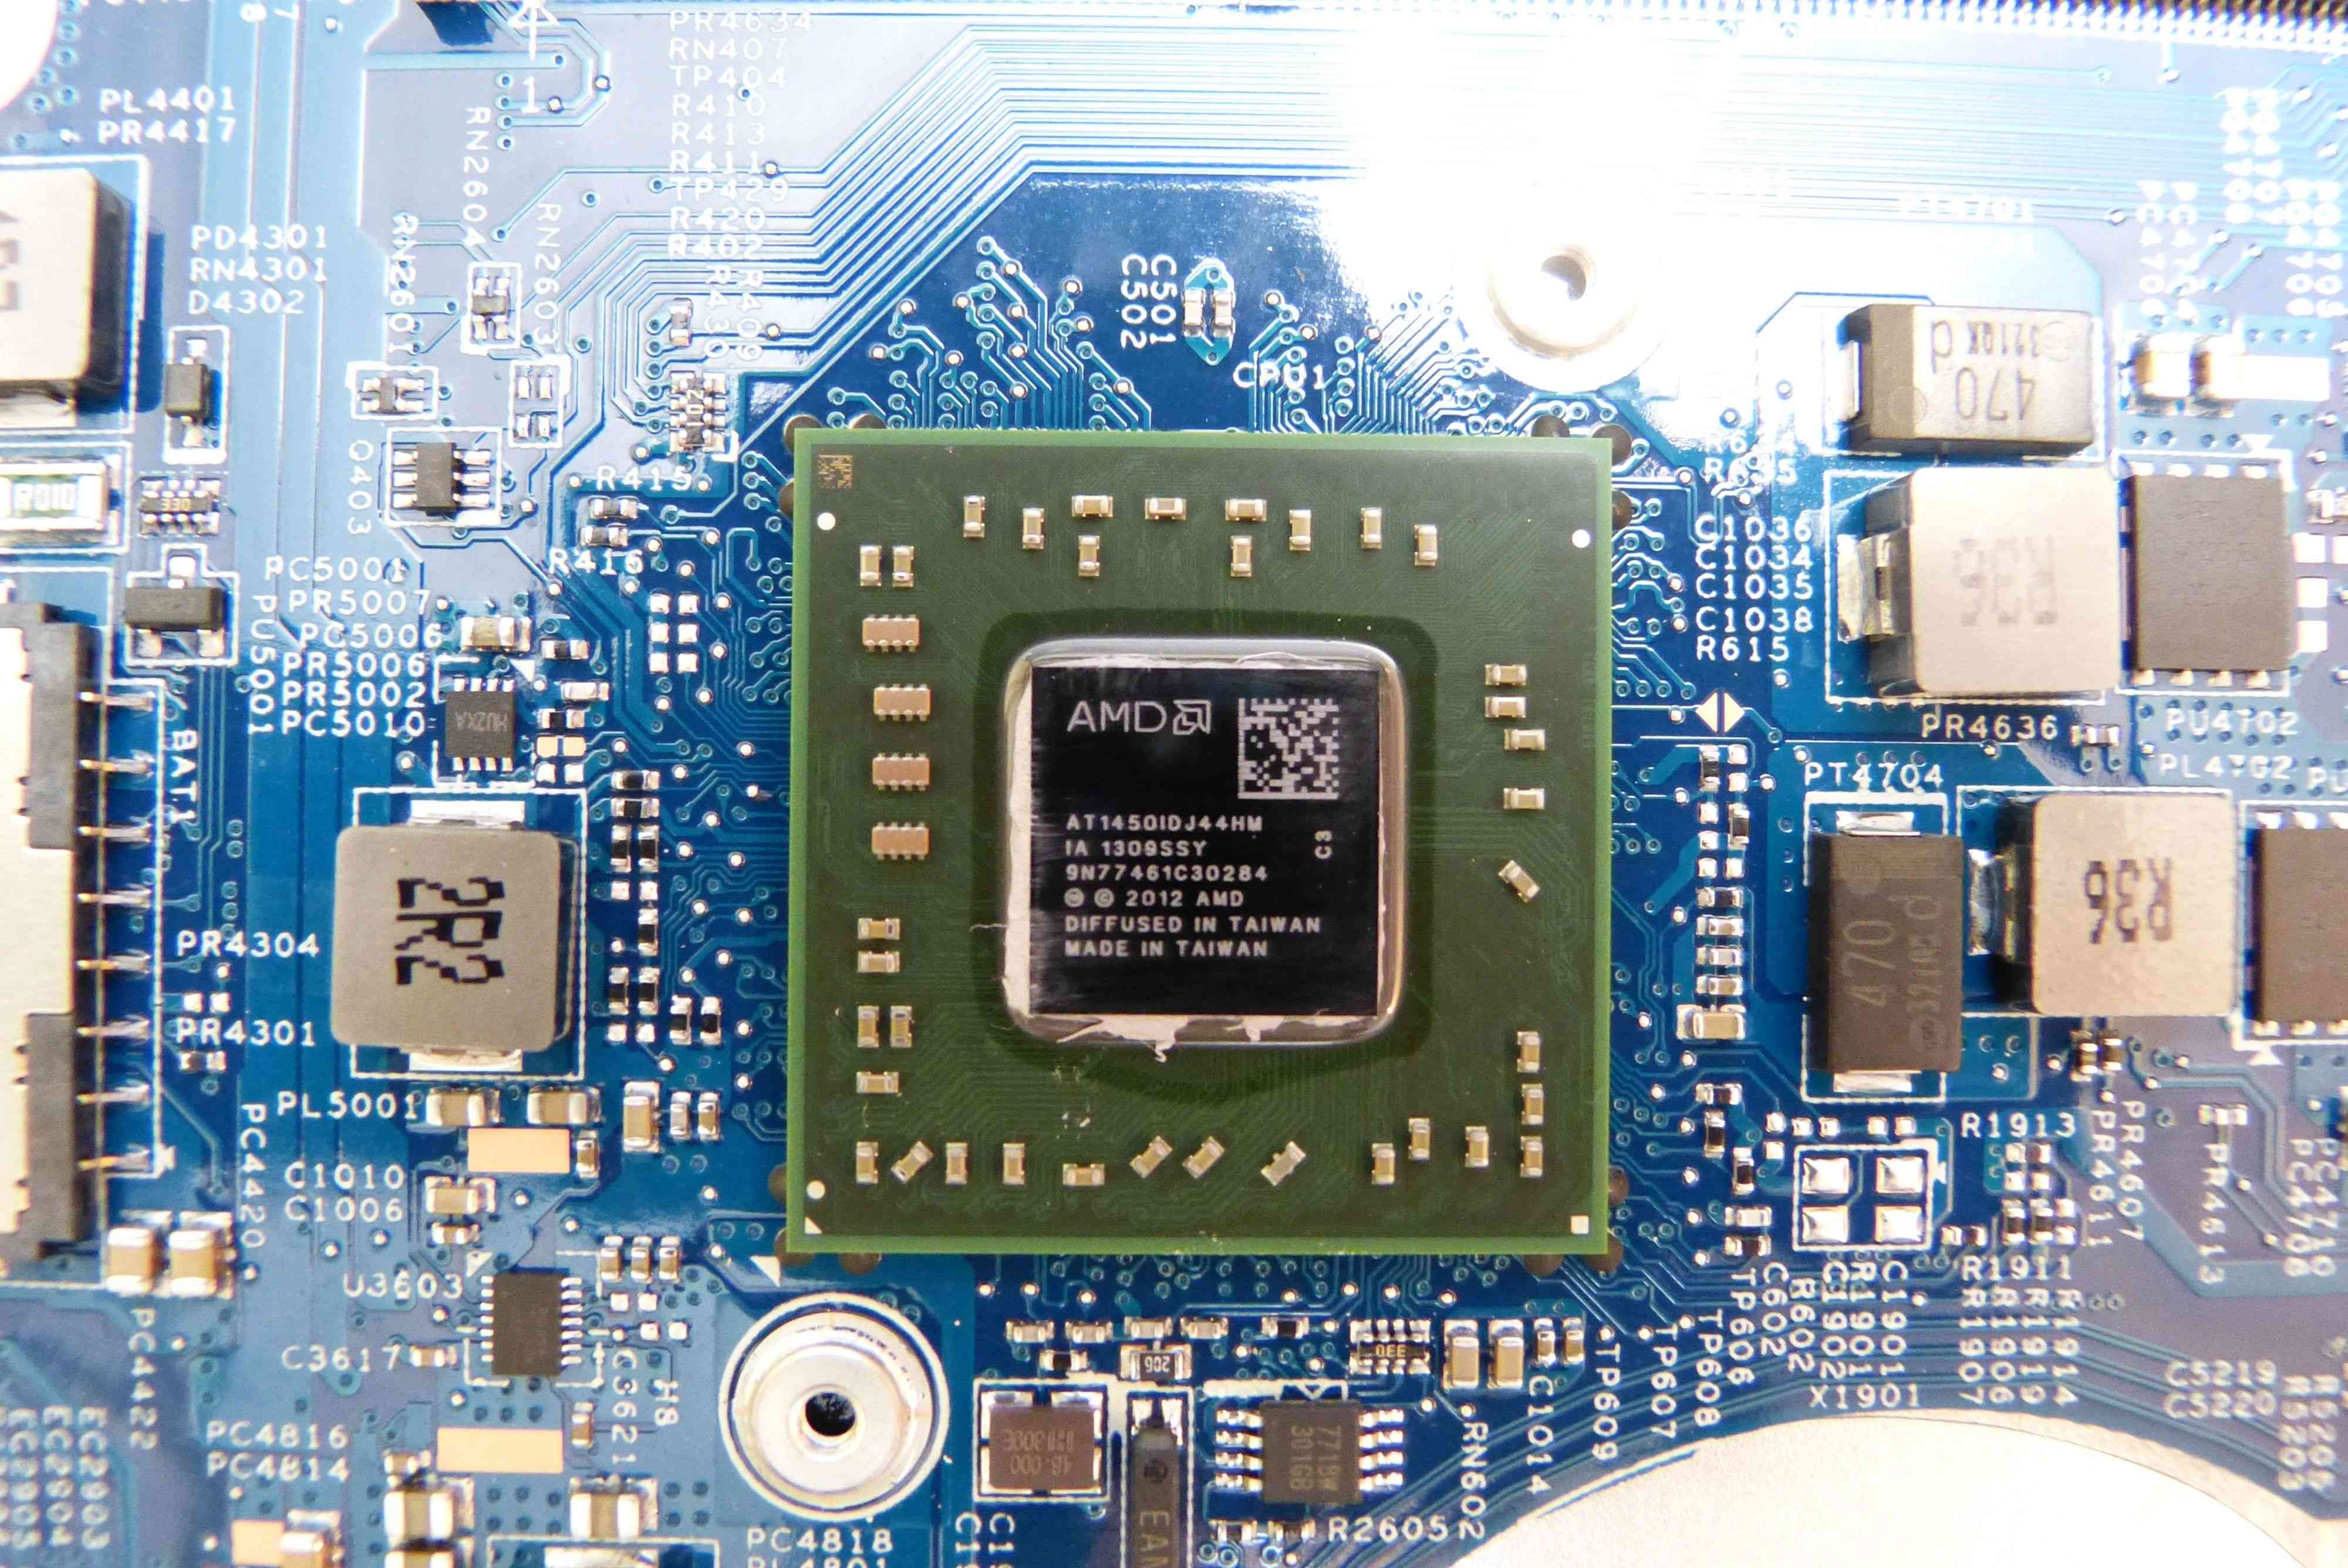
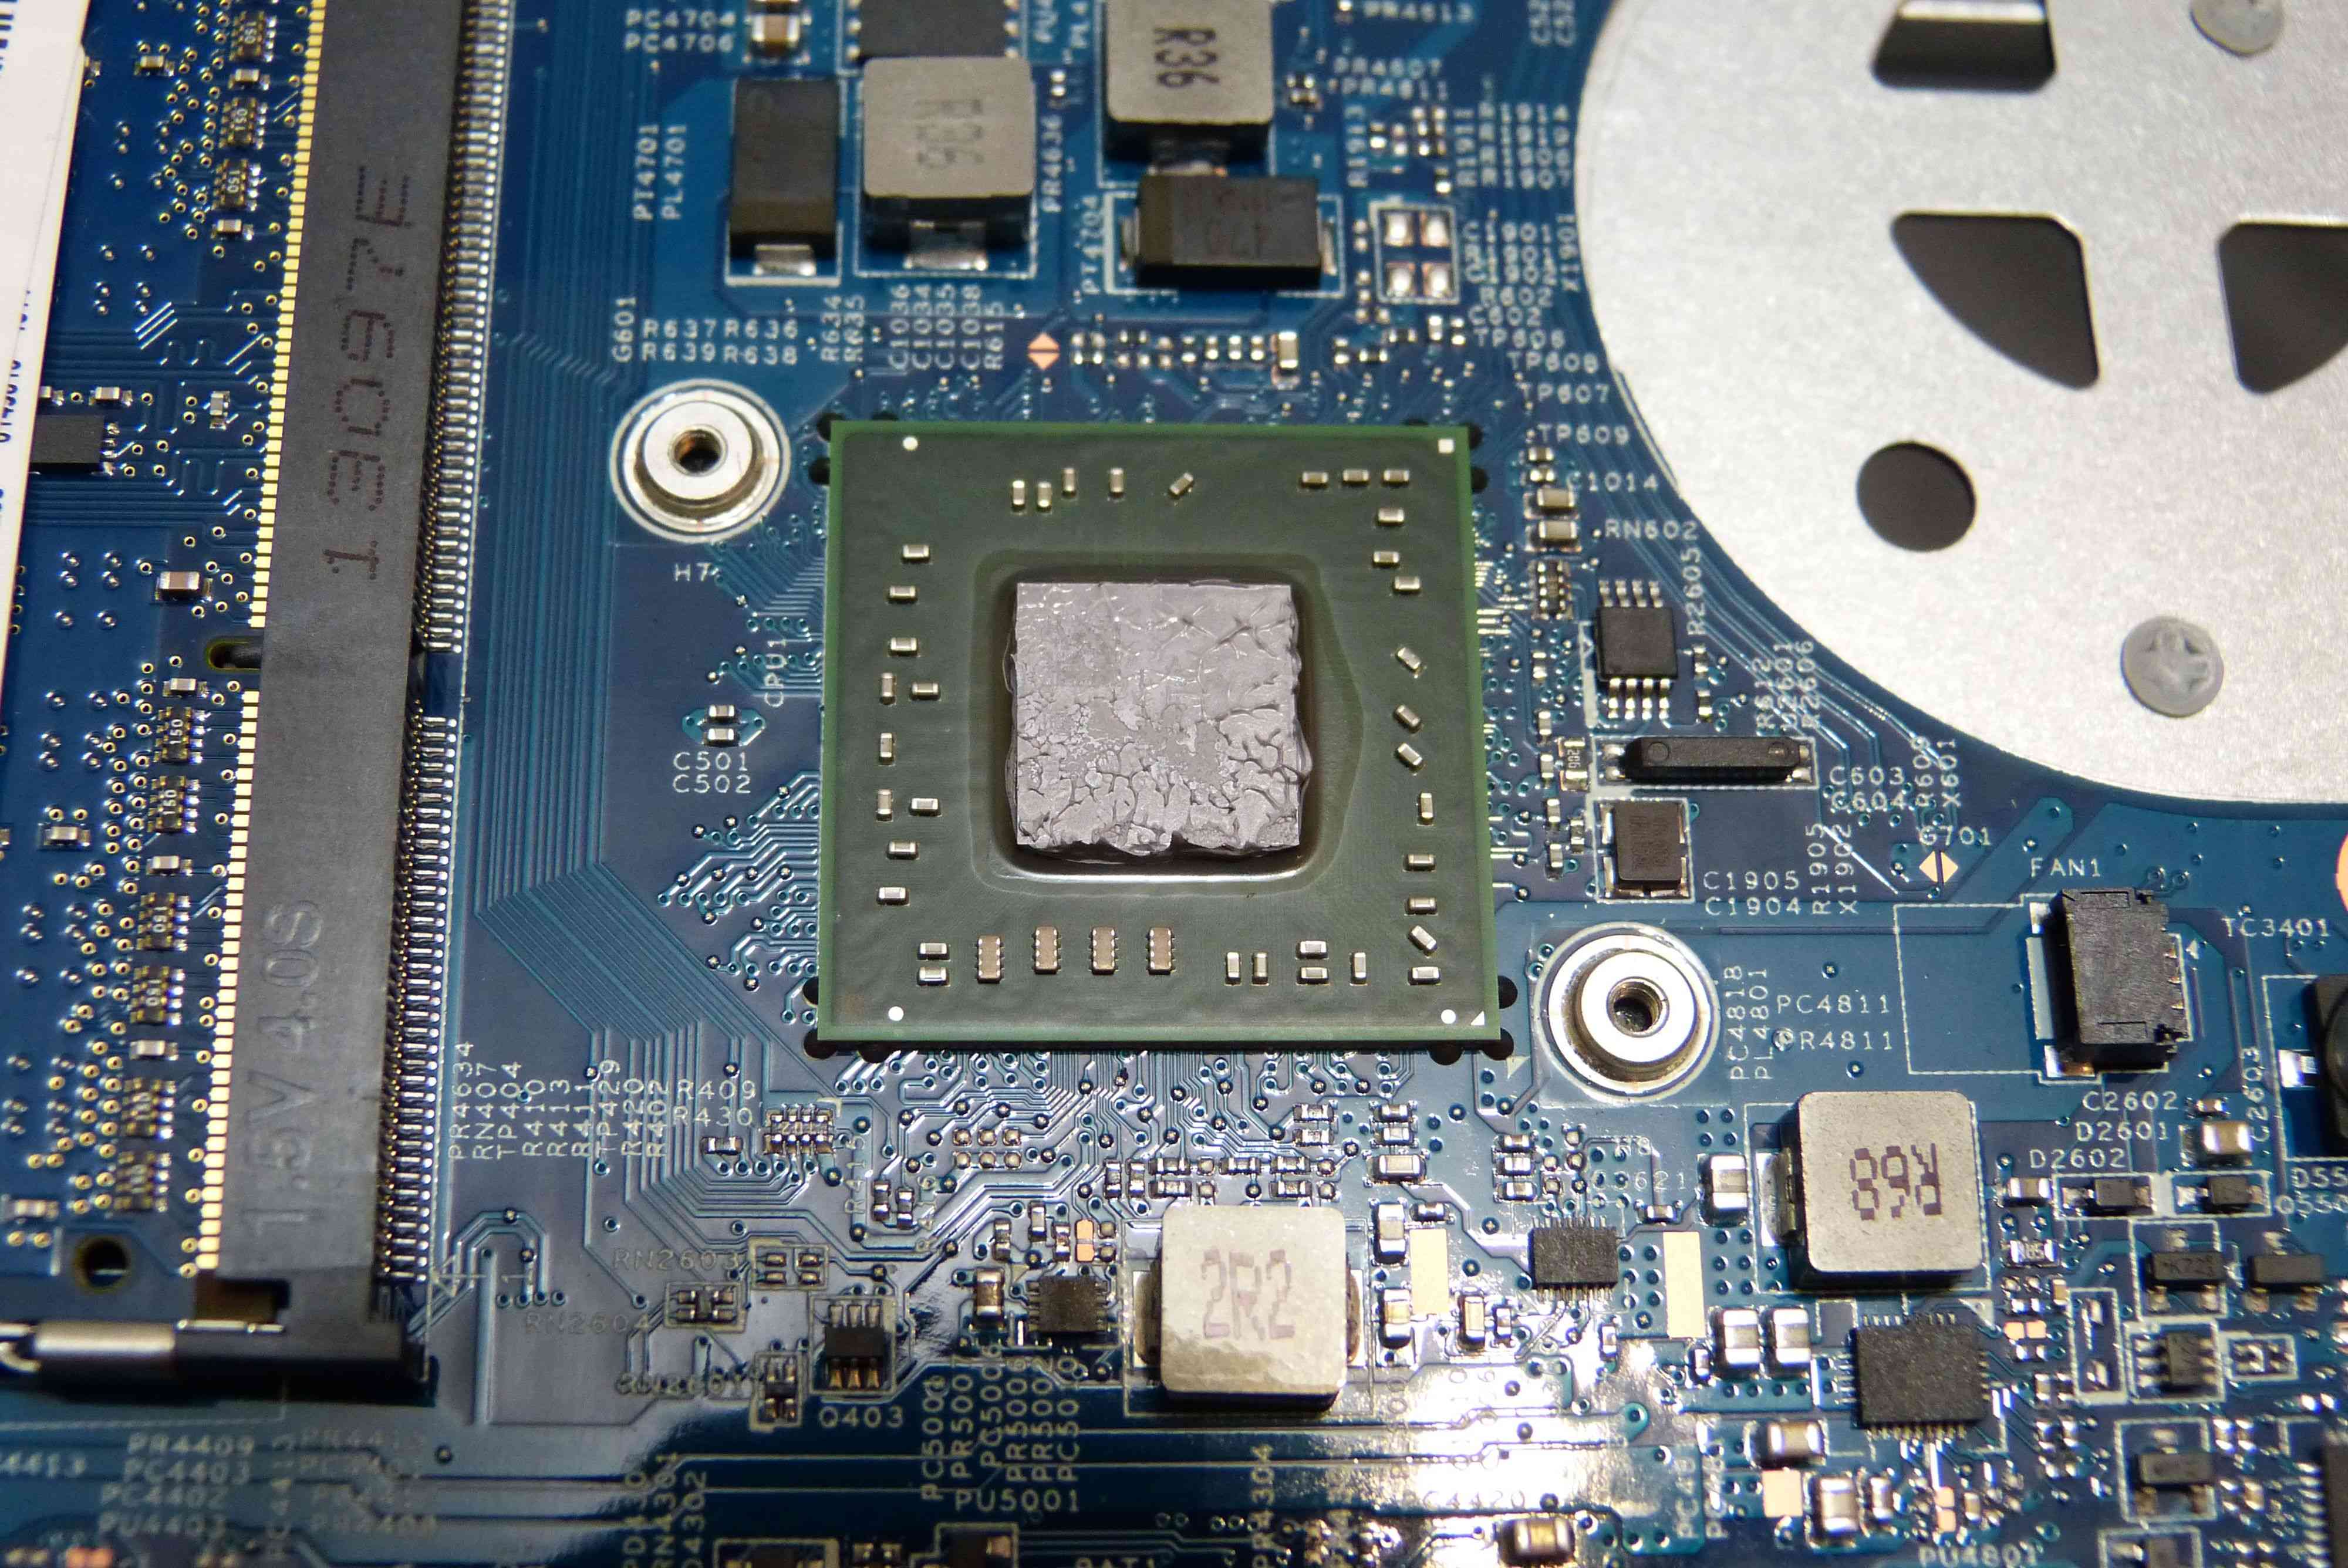
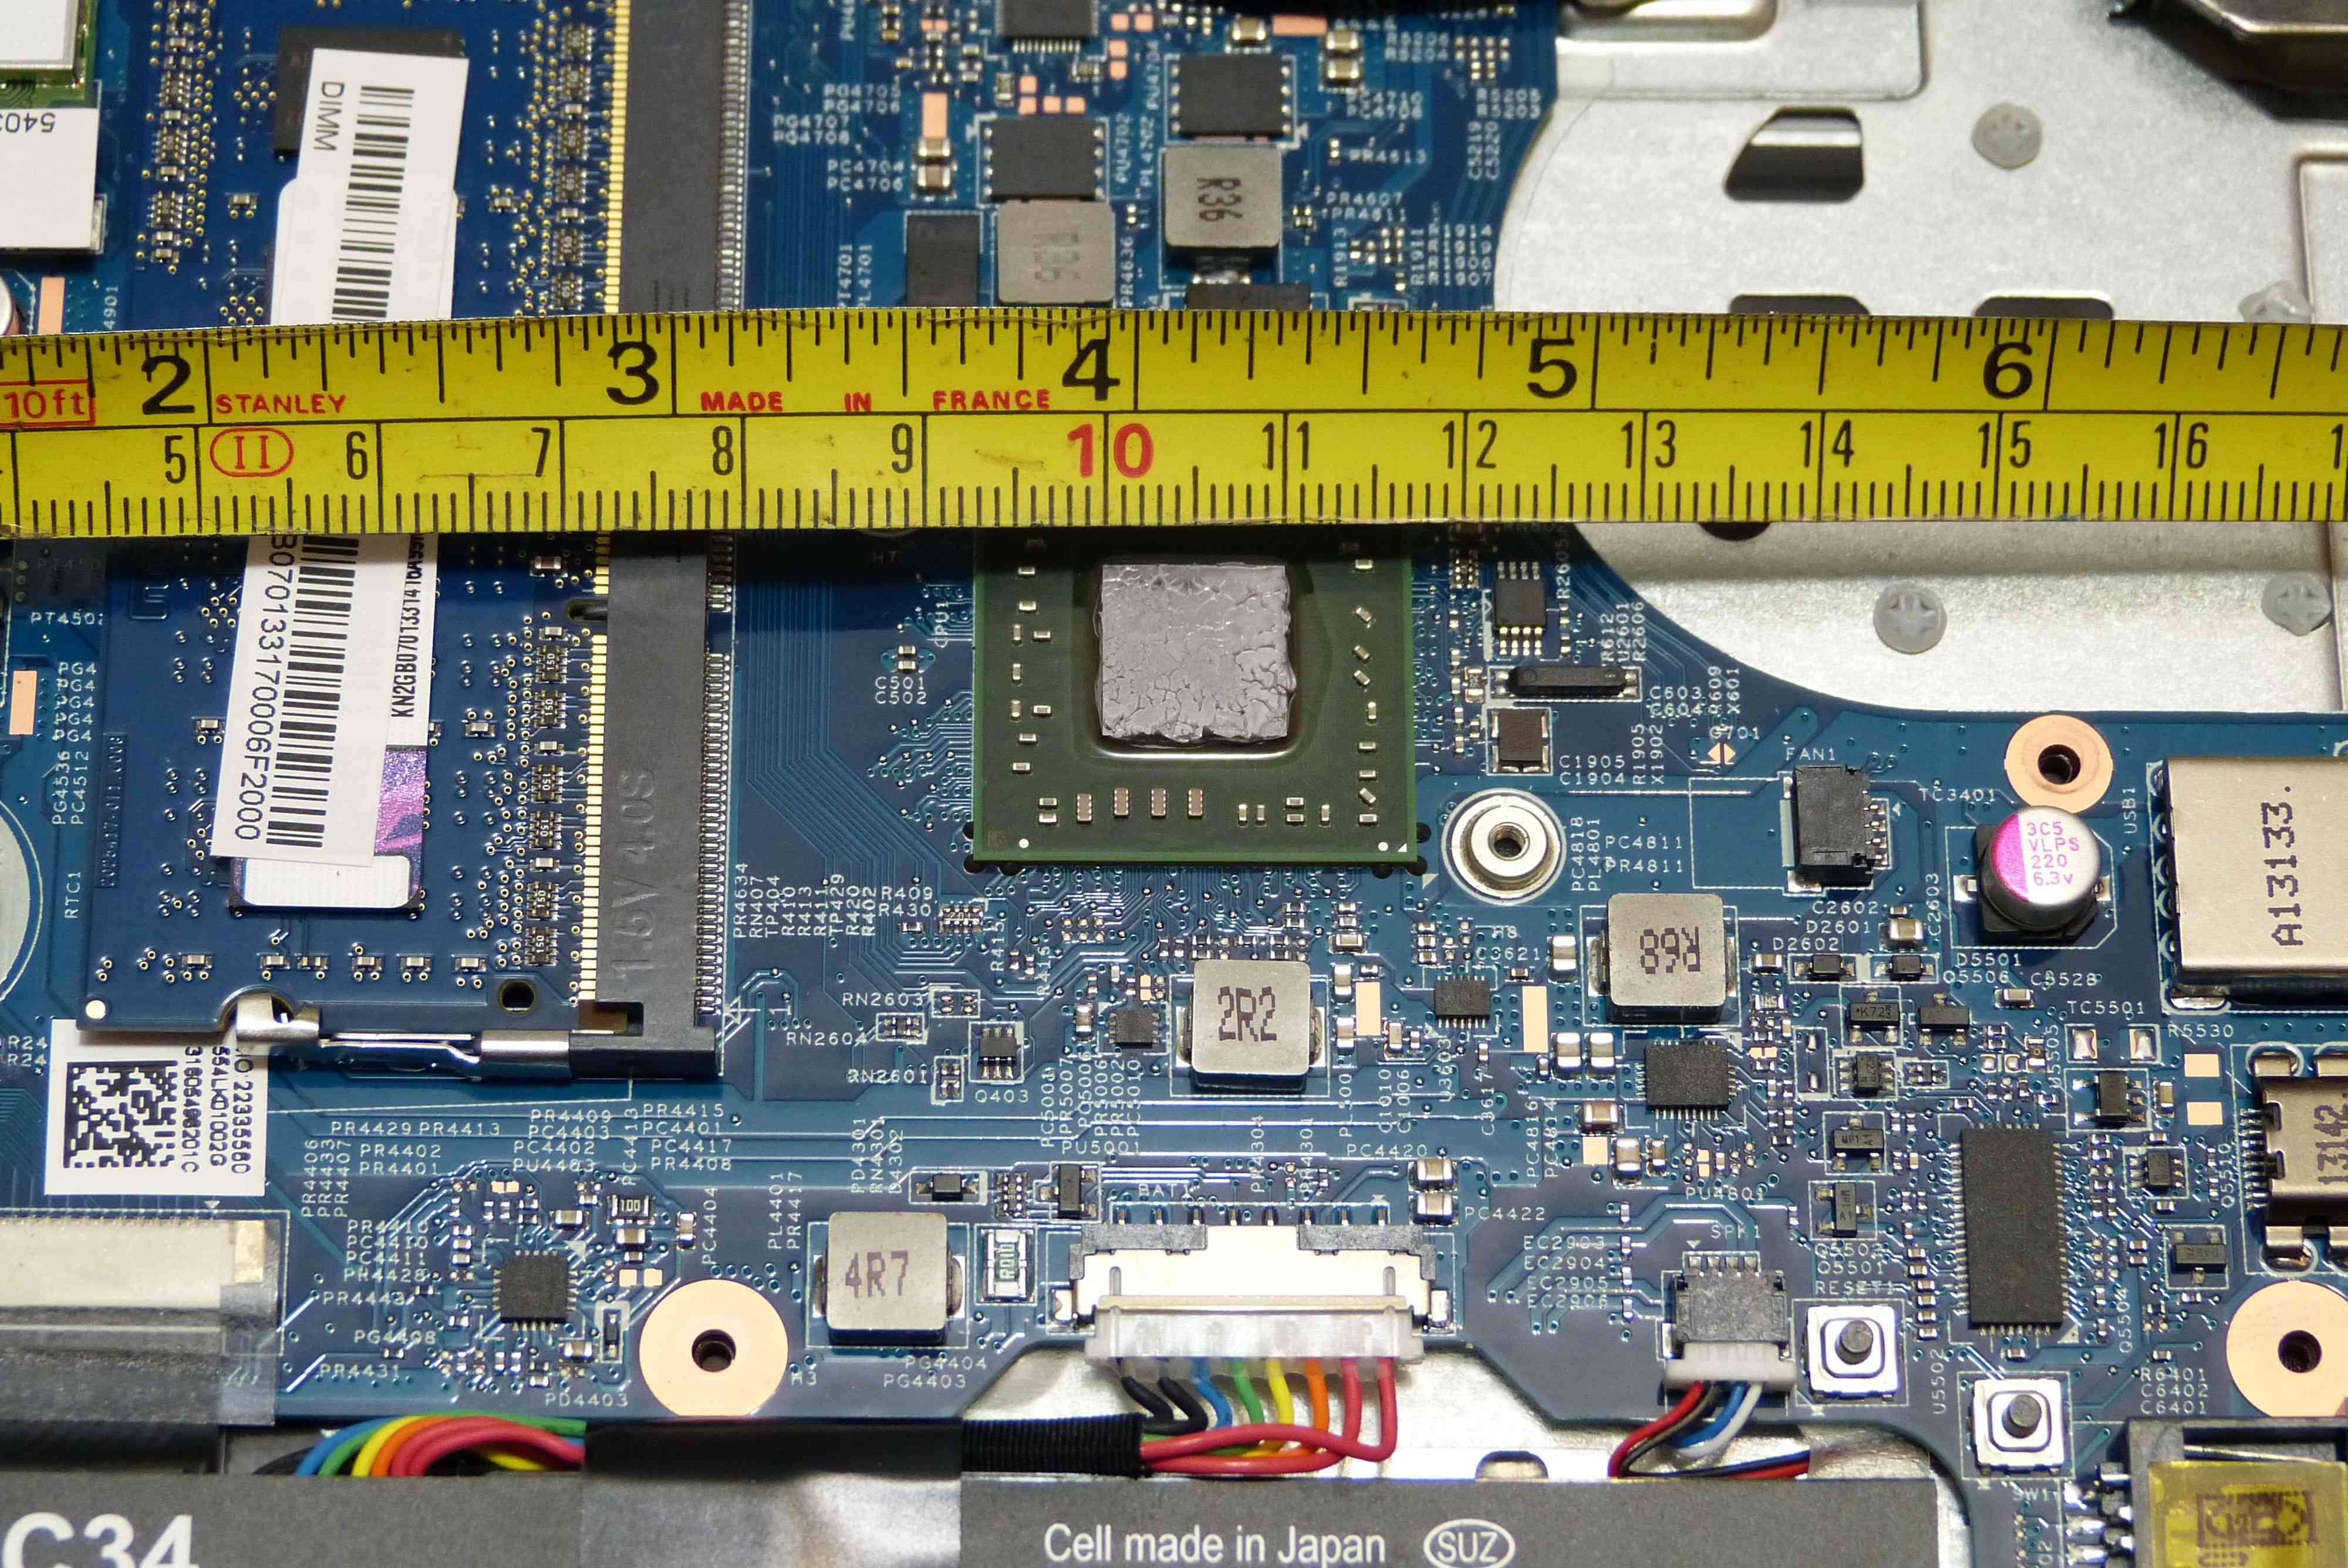
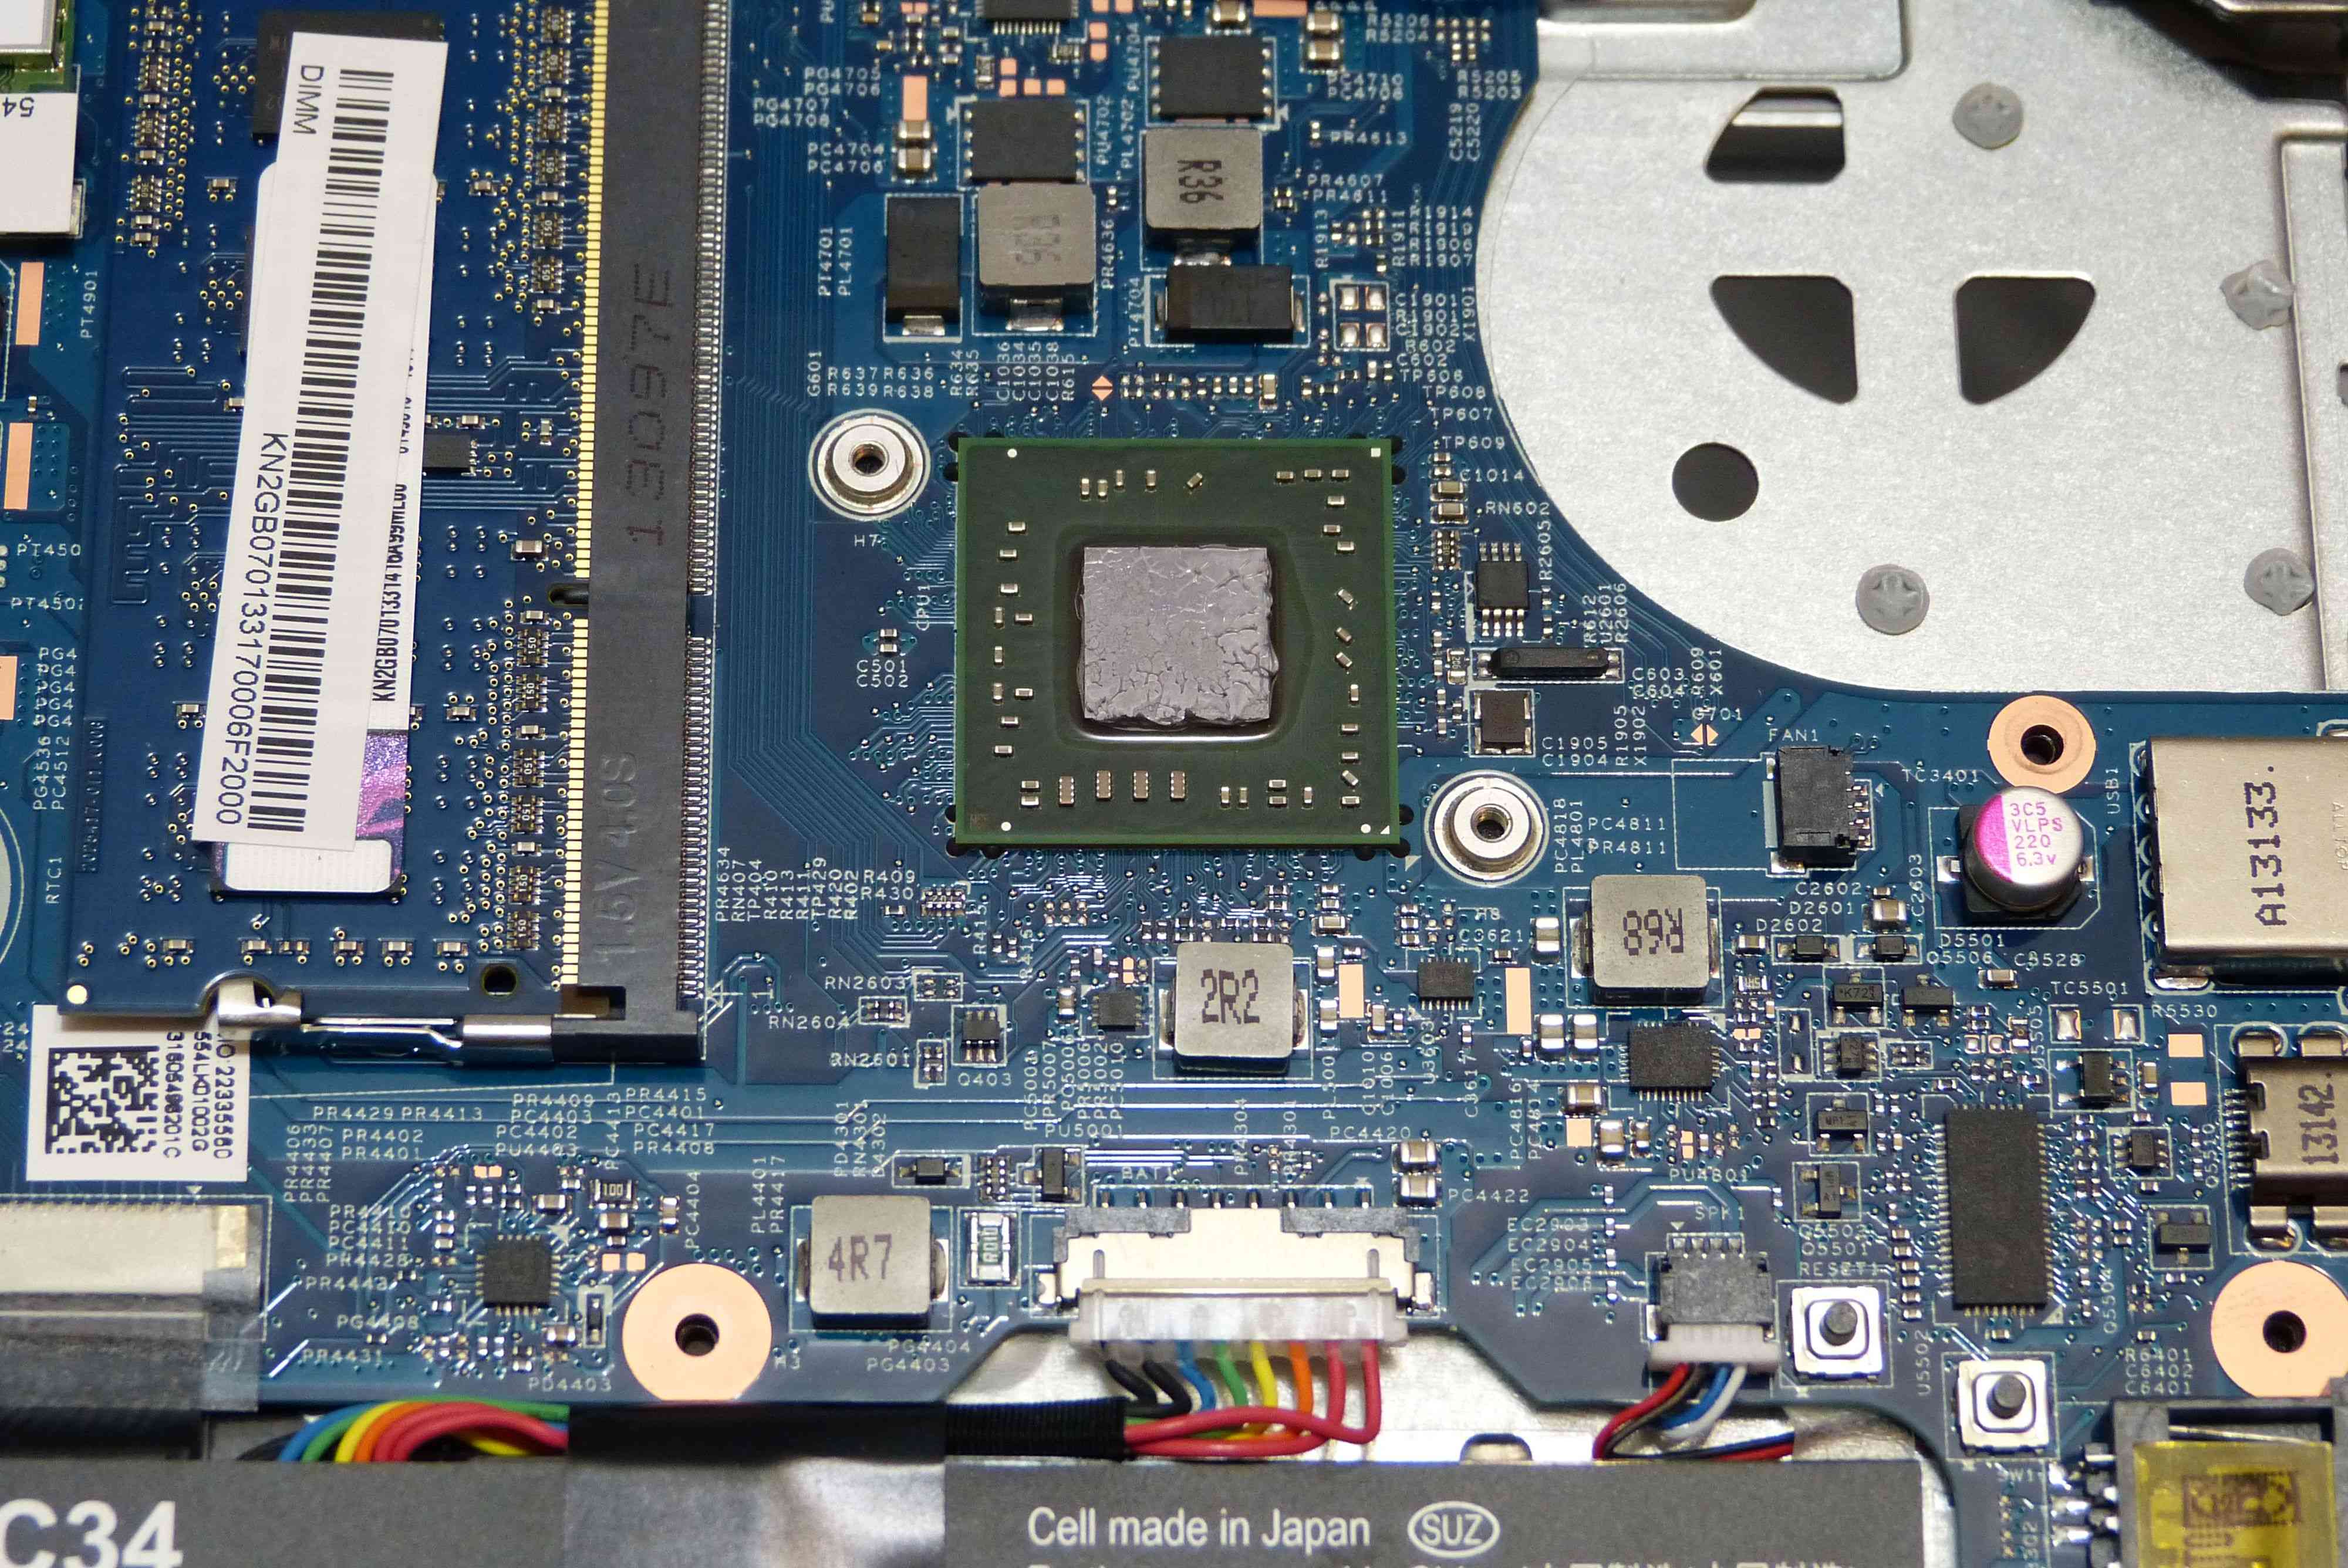
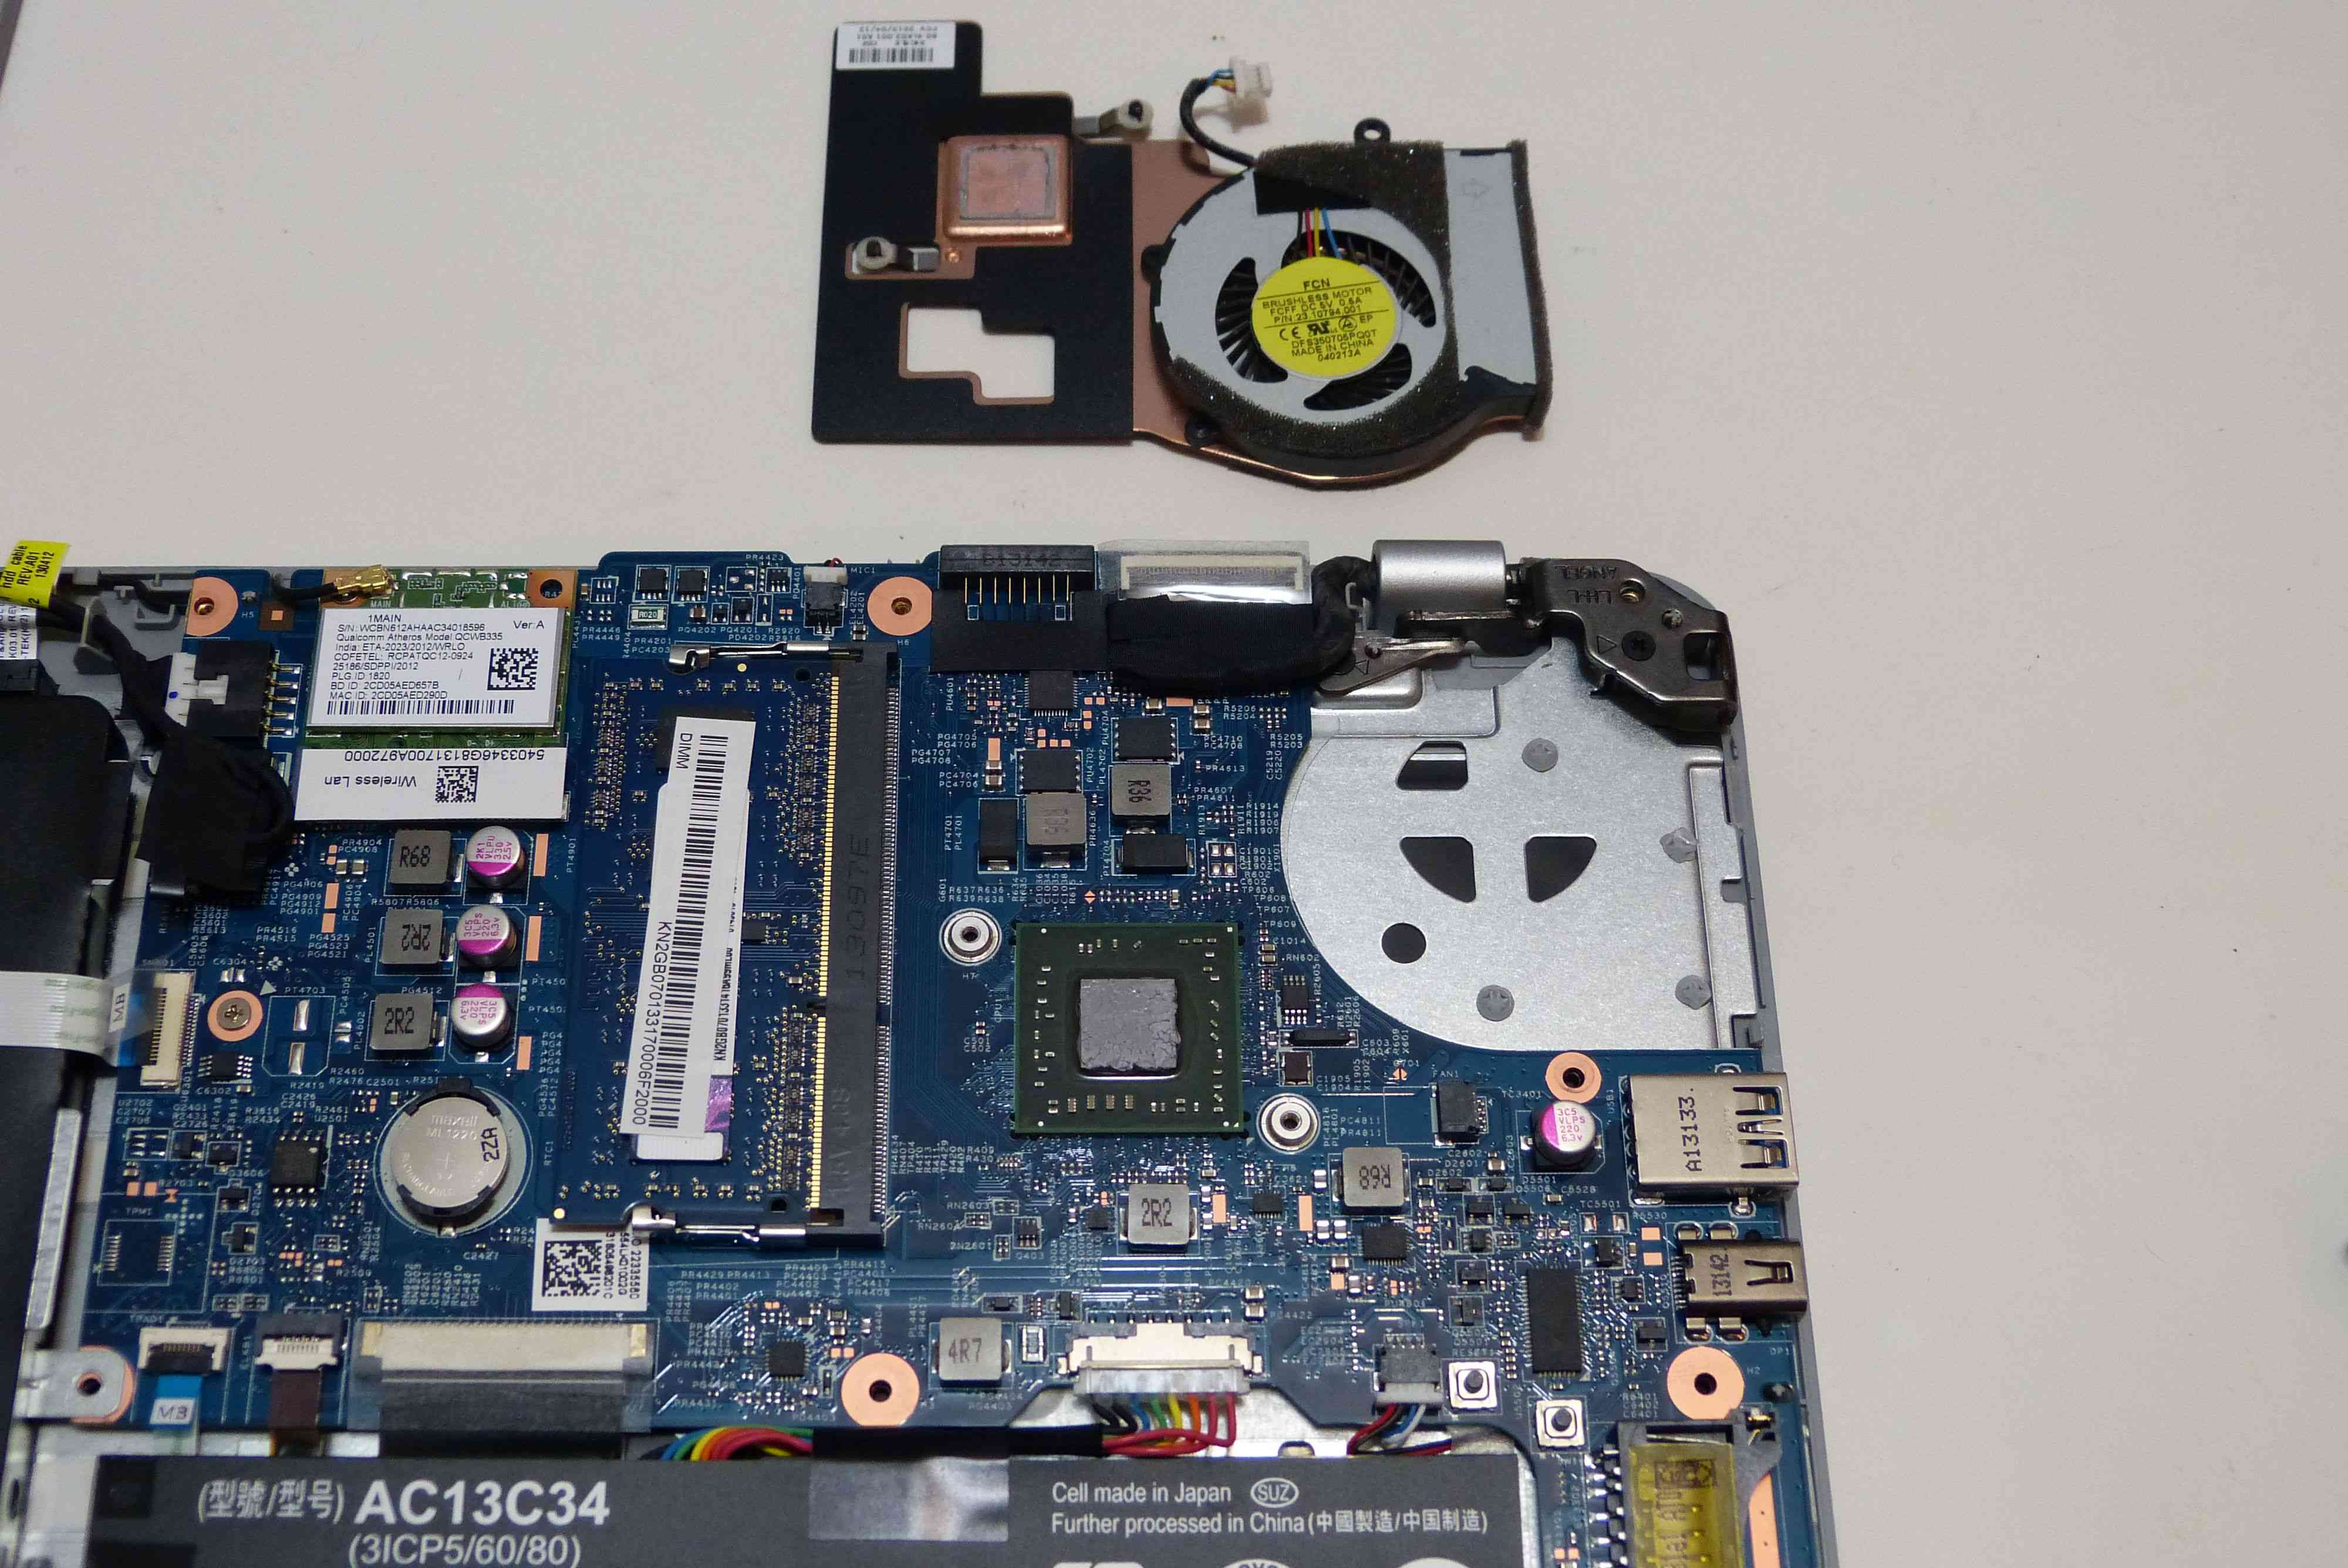
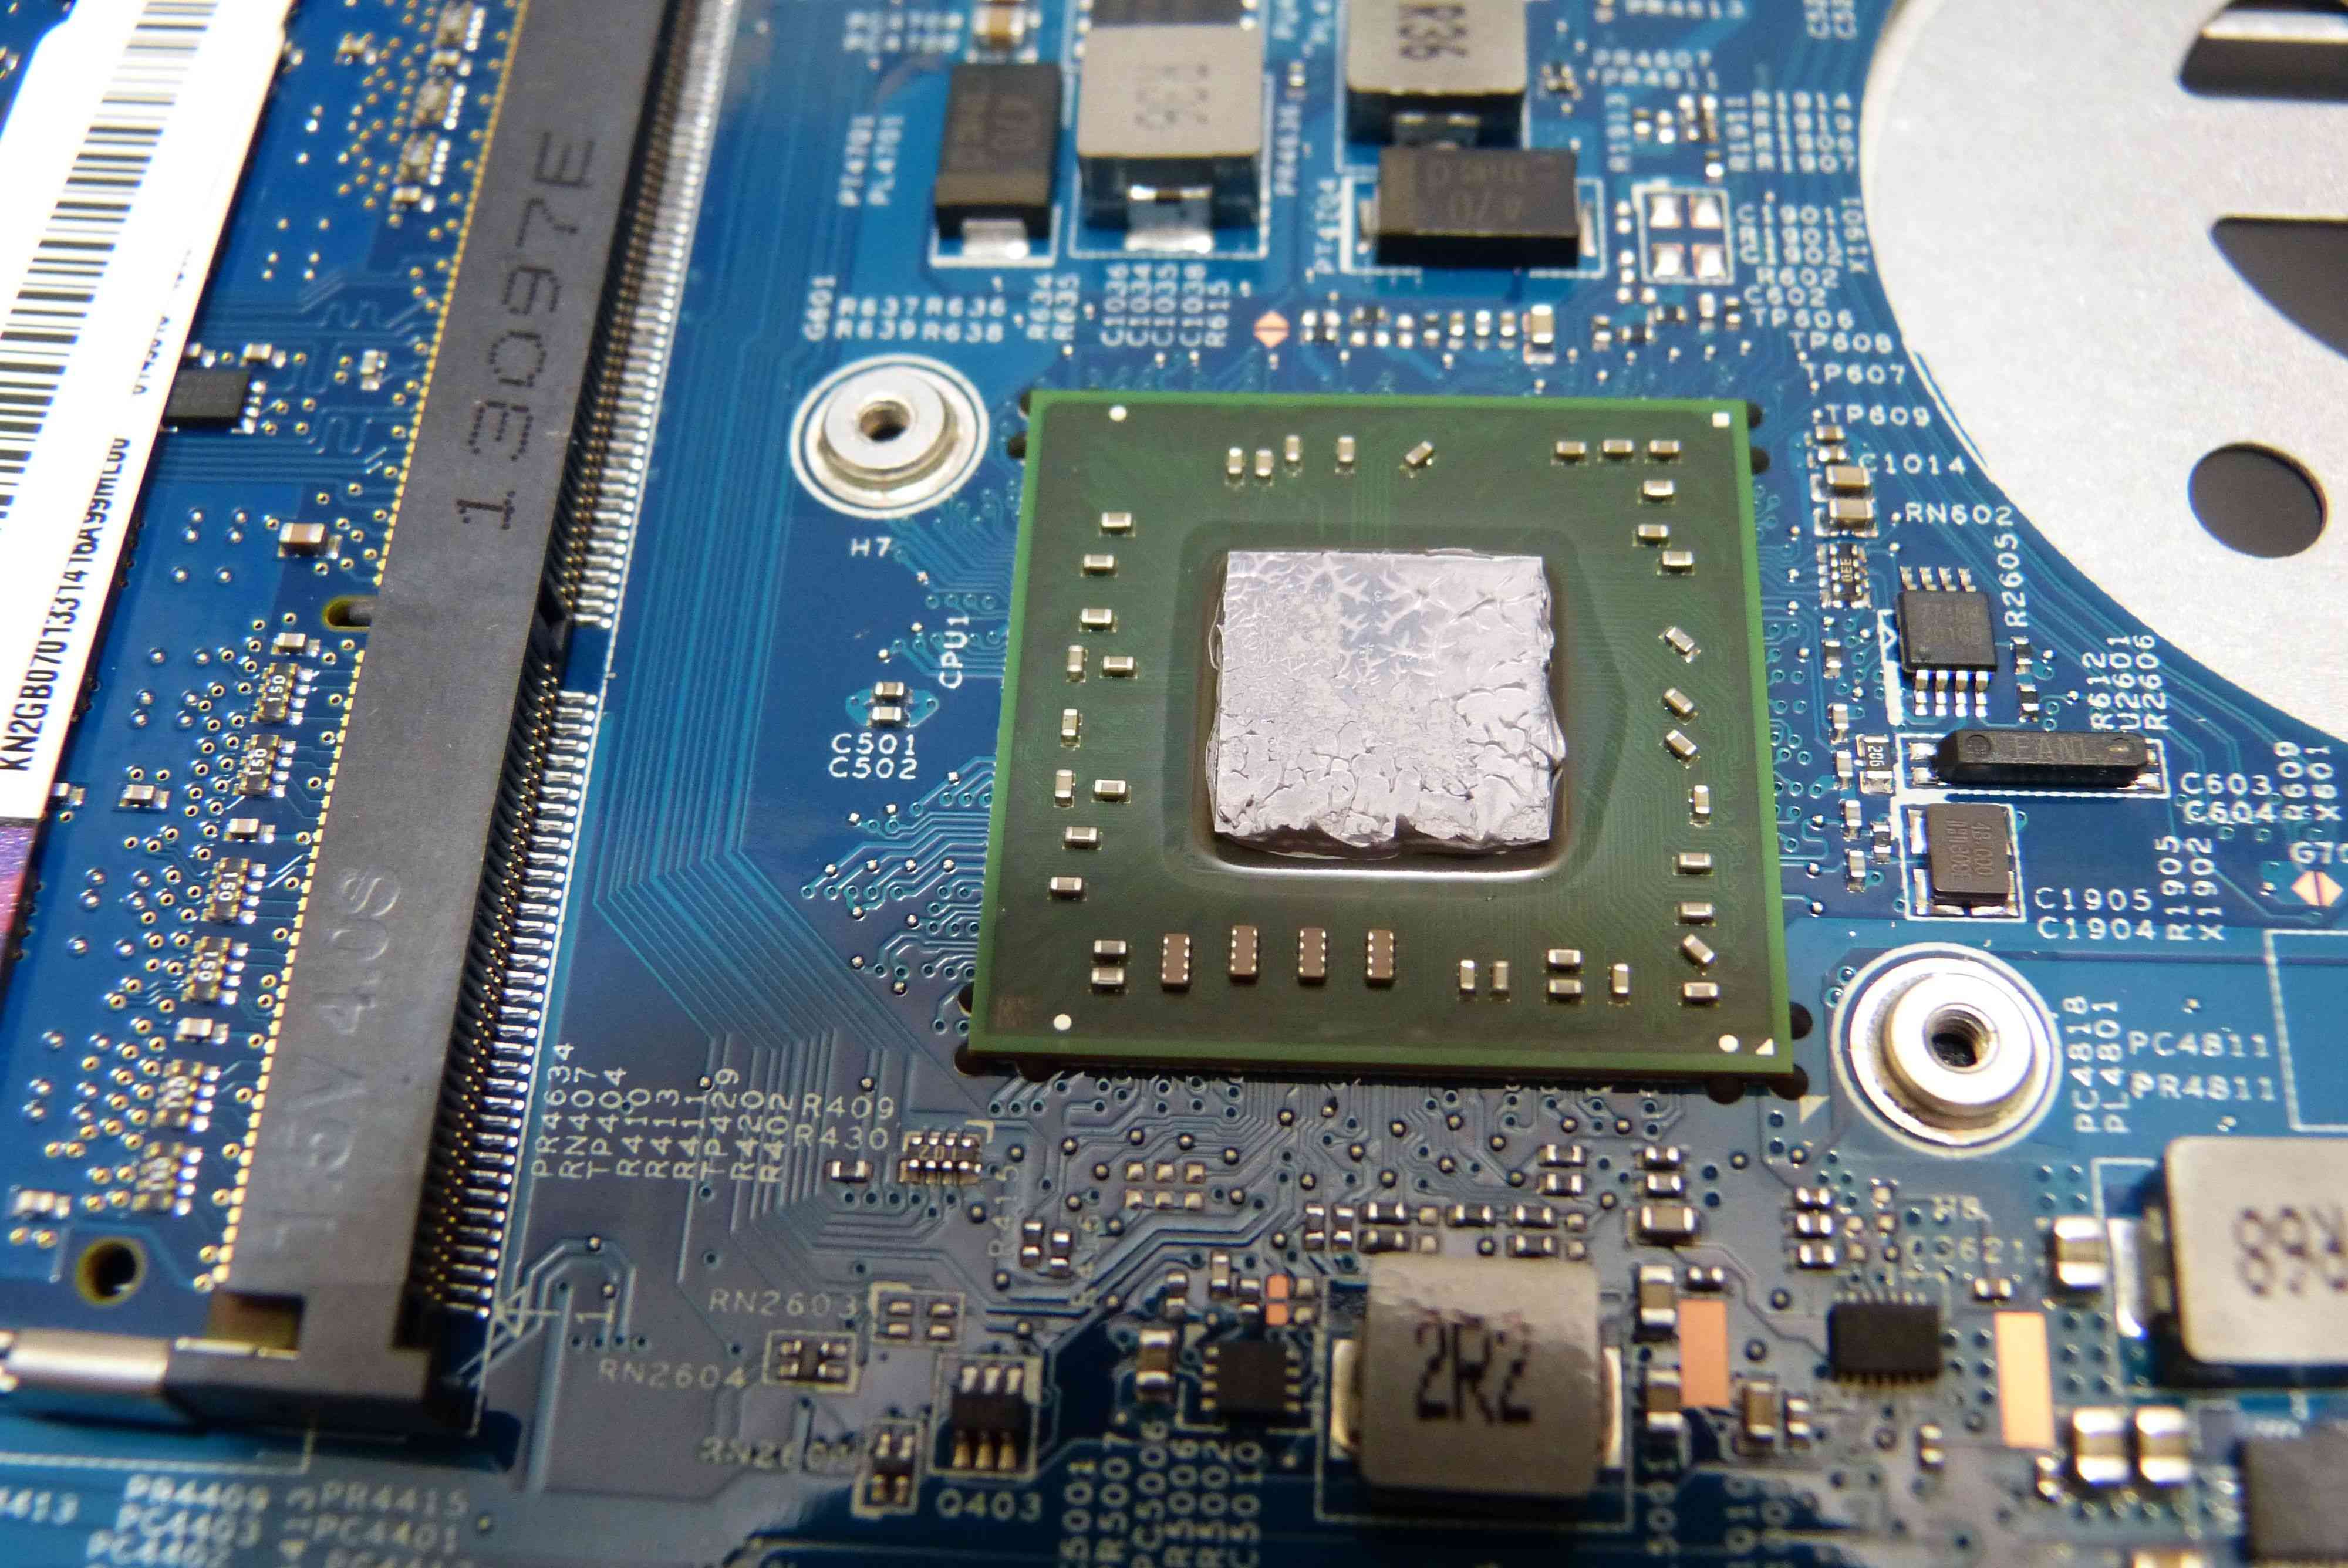
Images
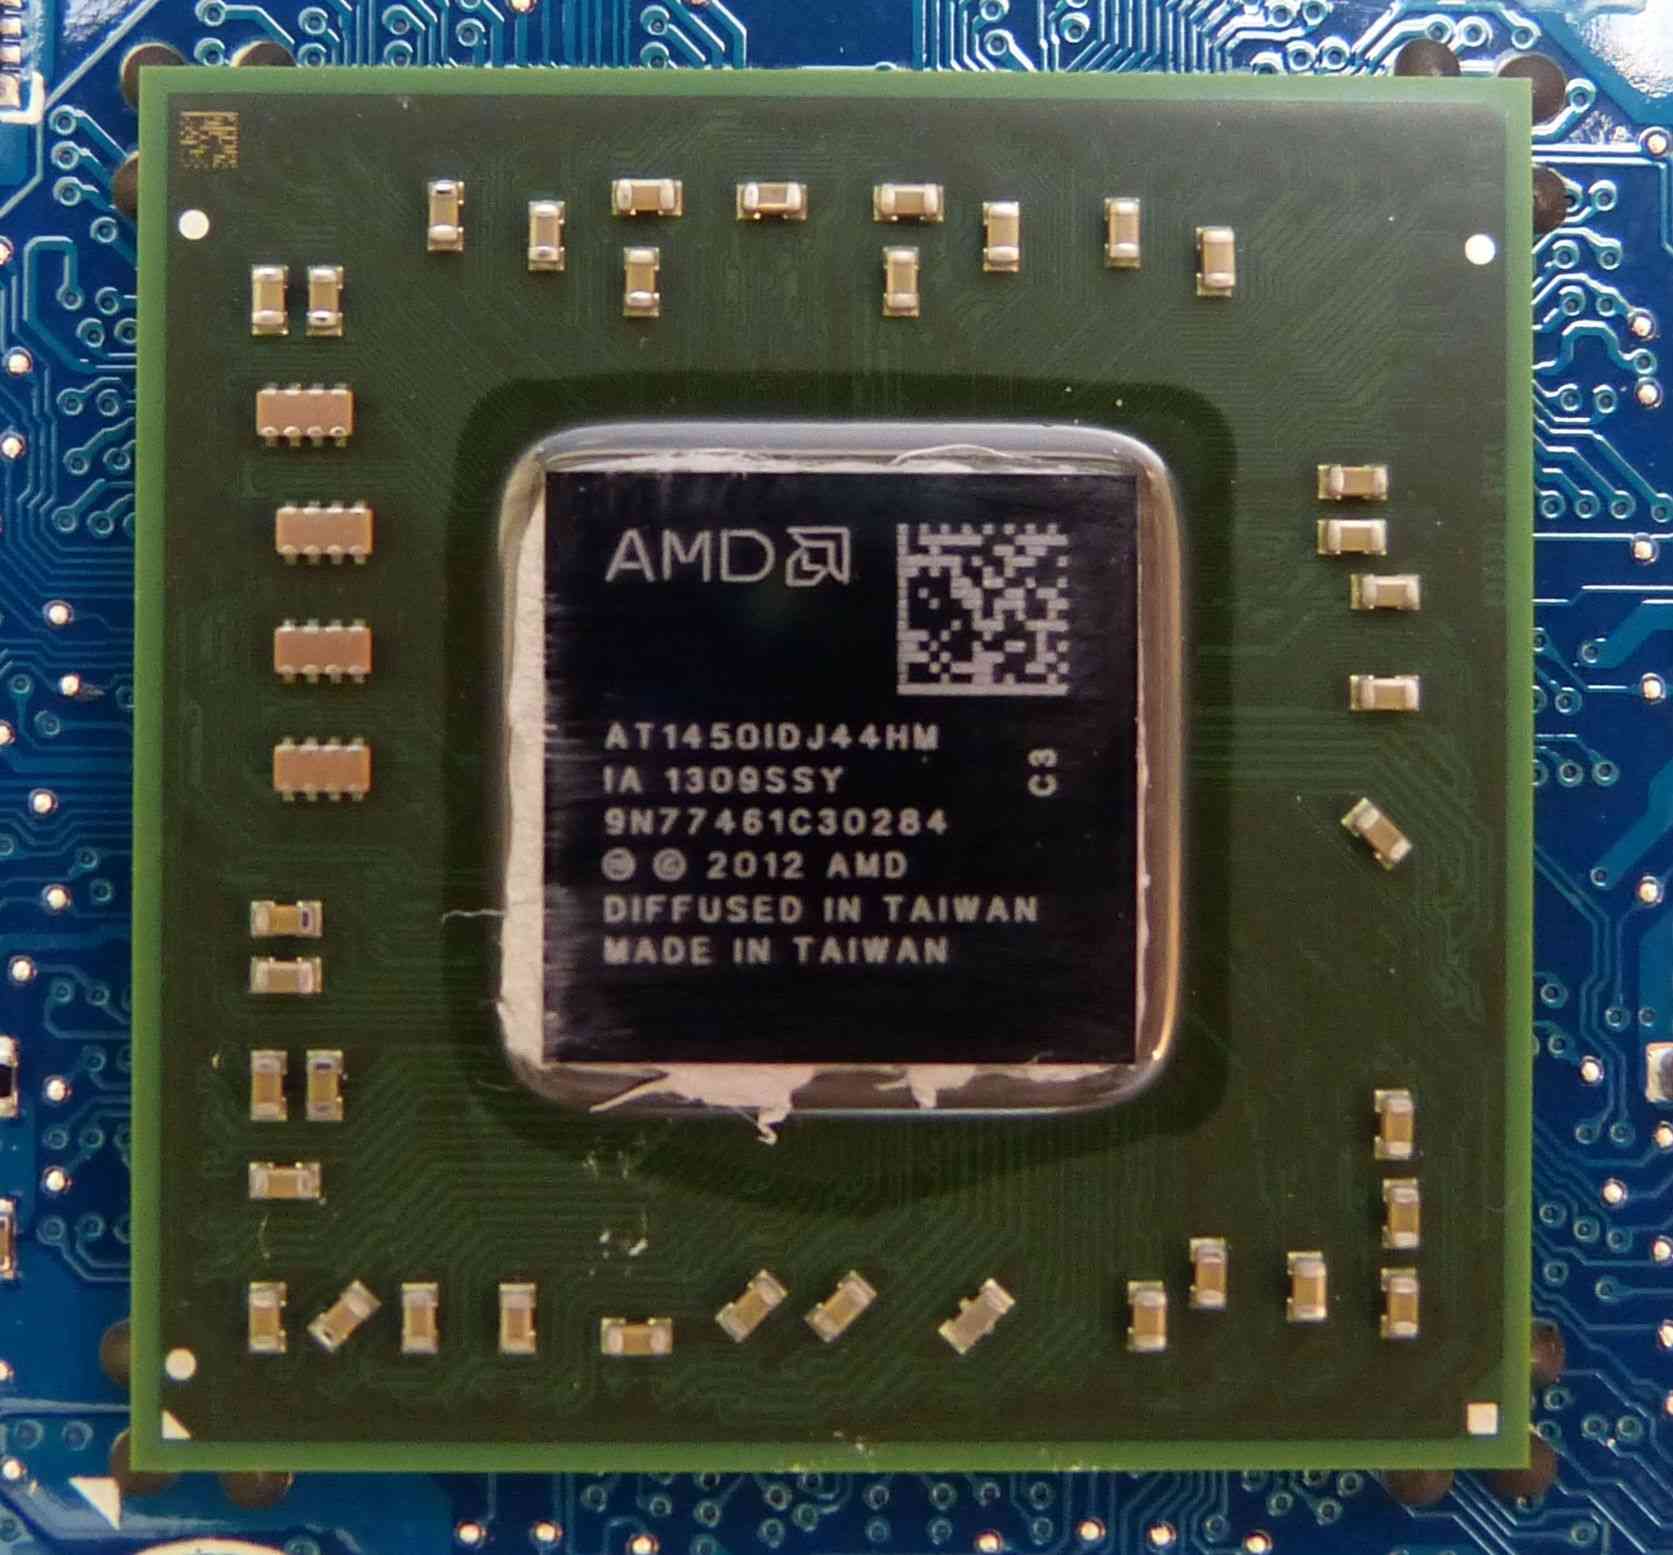
If this was ifixit you’d probably being seeing a score of 8 or more because there are a lot of serviceable parts inside. Even the heatsink is easy take off. You’ll see a close-up of the AMD A6-1450 below. A world exclusive of course ;-) Click for larger images.
- CPU ID: AT1450IDJ44HM
- IA 1309SSY
- 9N77461C30284


nice work, thx a lot.
“A background process is continuously taking 2-10% while these tests (System process, average 7%.)” found the same under win 7 on other pc’s. so far no idea how to stop this. this often is combined also with “strange” bursts of hard disk activity, draining the battery additionally.
You did CPU power usage, why no GPU power usage and CPU+GPU power usage? And you didn’t told what programm you used for CPU load. If you used Cinebench 11.5 then you better use Prime95 or something similar to measure the max power usage. Cinebench 11.5 was never that heavy.
gmb, good point. I re-did the tests with Prime95 torture tests and saw some higher figures. Article is updated.
REgarding GPU test, i’ve done one combined now but it’s hard to find a pure GPU test.
Isn’t Furmark a GPU pure test? If not, the total max power usage would be interesting. Prime95+Furmark or something like that would push it to hell. Btw, in some tests it’s not clear to me if you tested with Turbo enabled.
Chippy, thank you for these tests. And wath about hardware accelerated playing 4K video? It is possible on this APU? http://u.to/6F1yAw
How’s Linux support on these AMD APUs?
“A background process is continuously taking 2-10% while these tests (System process, average 7%.)”
You should probably find the cause of that to make your tests more meaningful. I have a Clover Trail tablet which idles 1%-3%. 2%-10% on a more powerful chip is a lot. It could be driver problems which users should be aware of when deciding to go with AMD based devices.
Anton. 4K testing is on my list although I don’t have a 4K monitor!
Tom. I’m going to do a fresh re-build on an SSD to try and solve this. There’s an issue here.
Notebookcheck was unable running CB 11.5 with 1,4 Ghz on all cores. What did you do to get 1,4 Ghz on all cores?
It’s difficult to say but on boot this morning I couldn’t get more then 900Mhz. After one standby cycle, nothing else, I was seeing 1.1ghz and after another standby cycle I was seeing 1.1ghz [correction 1.4Ghz] which stayed through all tests. There’s some sort of bug here in my opinion.
This is strange.
A test of a 10-bit H.264 video (a.k.a. HI10P profile) would be nice. 1280×720 or 1920×1080 resolution, it would be interesting what can the small CPU achieve in that.
/A suitable decoder would be LAV Video with MPC-HC player; or it could be tested with VLC or MPlayer2./
(This profile has no hardware acceleration support and needs to be decoded fully in software + teh CPU load is higher than high profile.)
Thanks for the testing, this notebook is quite interesting.
AMD driver issues, security software doing “screensaver” scan?
And from personal experience, you can tweak the min and max allowed CPU frequency in the Catalyst Control Center (seriously) independently of whatever the detailed settings are for the Windows power profile.
Hi Chippy,
3DMark06 result is resolution of 1366×768 pixels ?
Sorry Tralalak. This is 1280×7680 resolution in the test. (3DMark06 basic edition) I’ll add info above.
Naked pics added!
You can google Intel Atom and i3 bugs and find millions of users who had to deal with a number of problems from wi-fi unreliability to horrible glitchy graphics.
By comparison, AMD already has their GPUs which support ZeroCore power and it won’t be long before their Jaguar APUs have updated power firmware and drivers.
Chippy…
Can you please turn off two cores and clock other cores to 2-2.8Ghz to see real performance of A6-1450 if all cores were used, thank you.
Hello Chippy,
have you find solutions for the problems with the background process or the turbo on all four cores yet?
Thank you!
Turbo works on all four cores after repeat sleep-resume cycles. Sounds like a hug to me. As for background process I fear a poor OS build. Suspect some sort of logging or debugging is enabled.
Hello Chippy,
thank you. I tested it on my V5 122p and the turbo works on all cores, too. And I found out that the background process is about 2-6% when turbo works on all cores. Without turbo on all cores its about 6-12%. With new beta driver 13.6 from AMD I reached 1.36 on Cinebench cpu test istead of 1.31.
Great news Manuel!
Hi Chippy and/or others that have access to such a device,
did anyone of you test:
– whether the memory is upgradeable with a 8GB SO-DIMM?
The soldered 2GB + 8GB should add up to 10 GB max. memory. Did anyone try that?
– whether you can plug a displayport MST hub into this Acer special port
and if yes how many FullHD monitors you can actually drive with it?
(http://www.club-3d.com/index.php/products/reader.en/product/mst-hub-1-3.html)
Thank you!